File:Cross-borehole-tomography-in-development-geology fig5.jpg
Jump to navigation
Jump to search

Size of this preview: 754 × 600 pixels. Other resolutions: 302 × 240 pixels | 2,000 × 1,591 pixels.
Original file (2,000 × 1,591 pixels, file size: 1.16 MB, MIME type: image/jpeg)
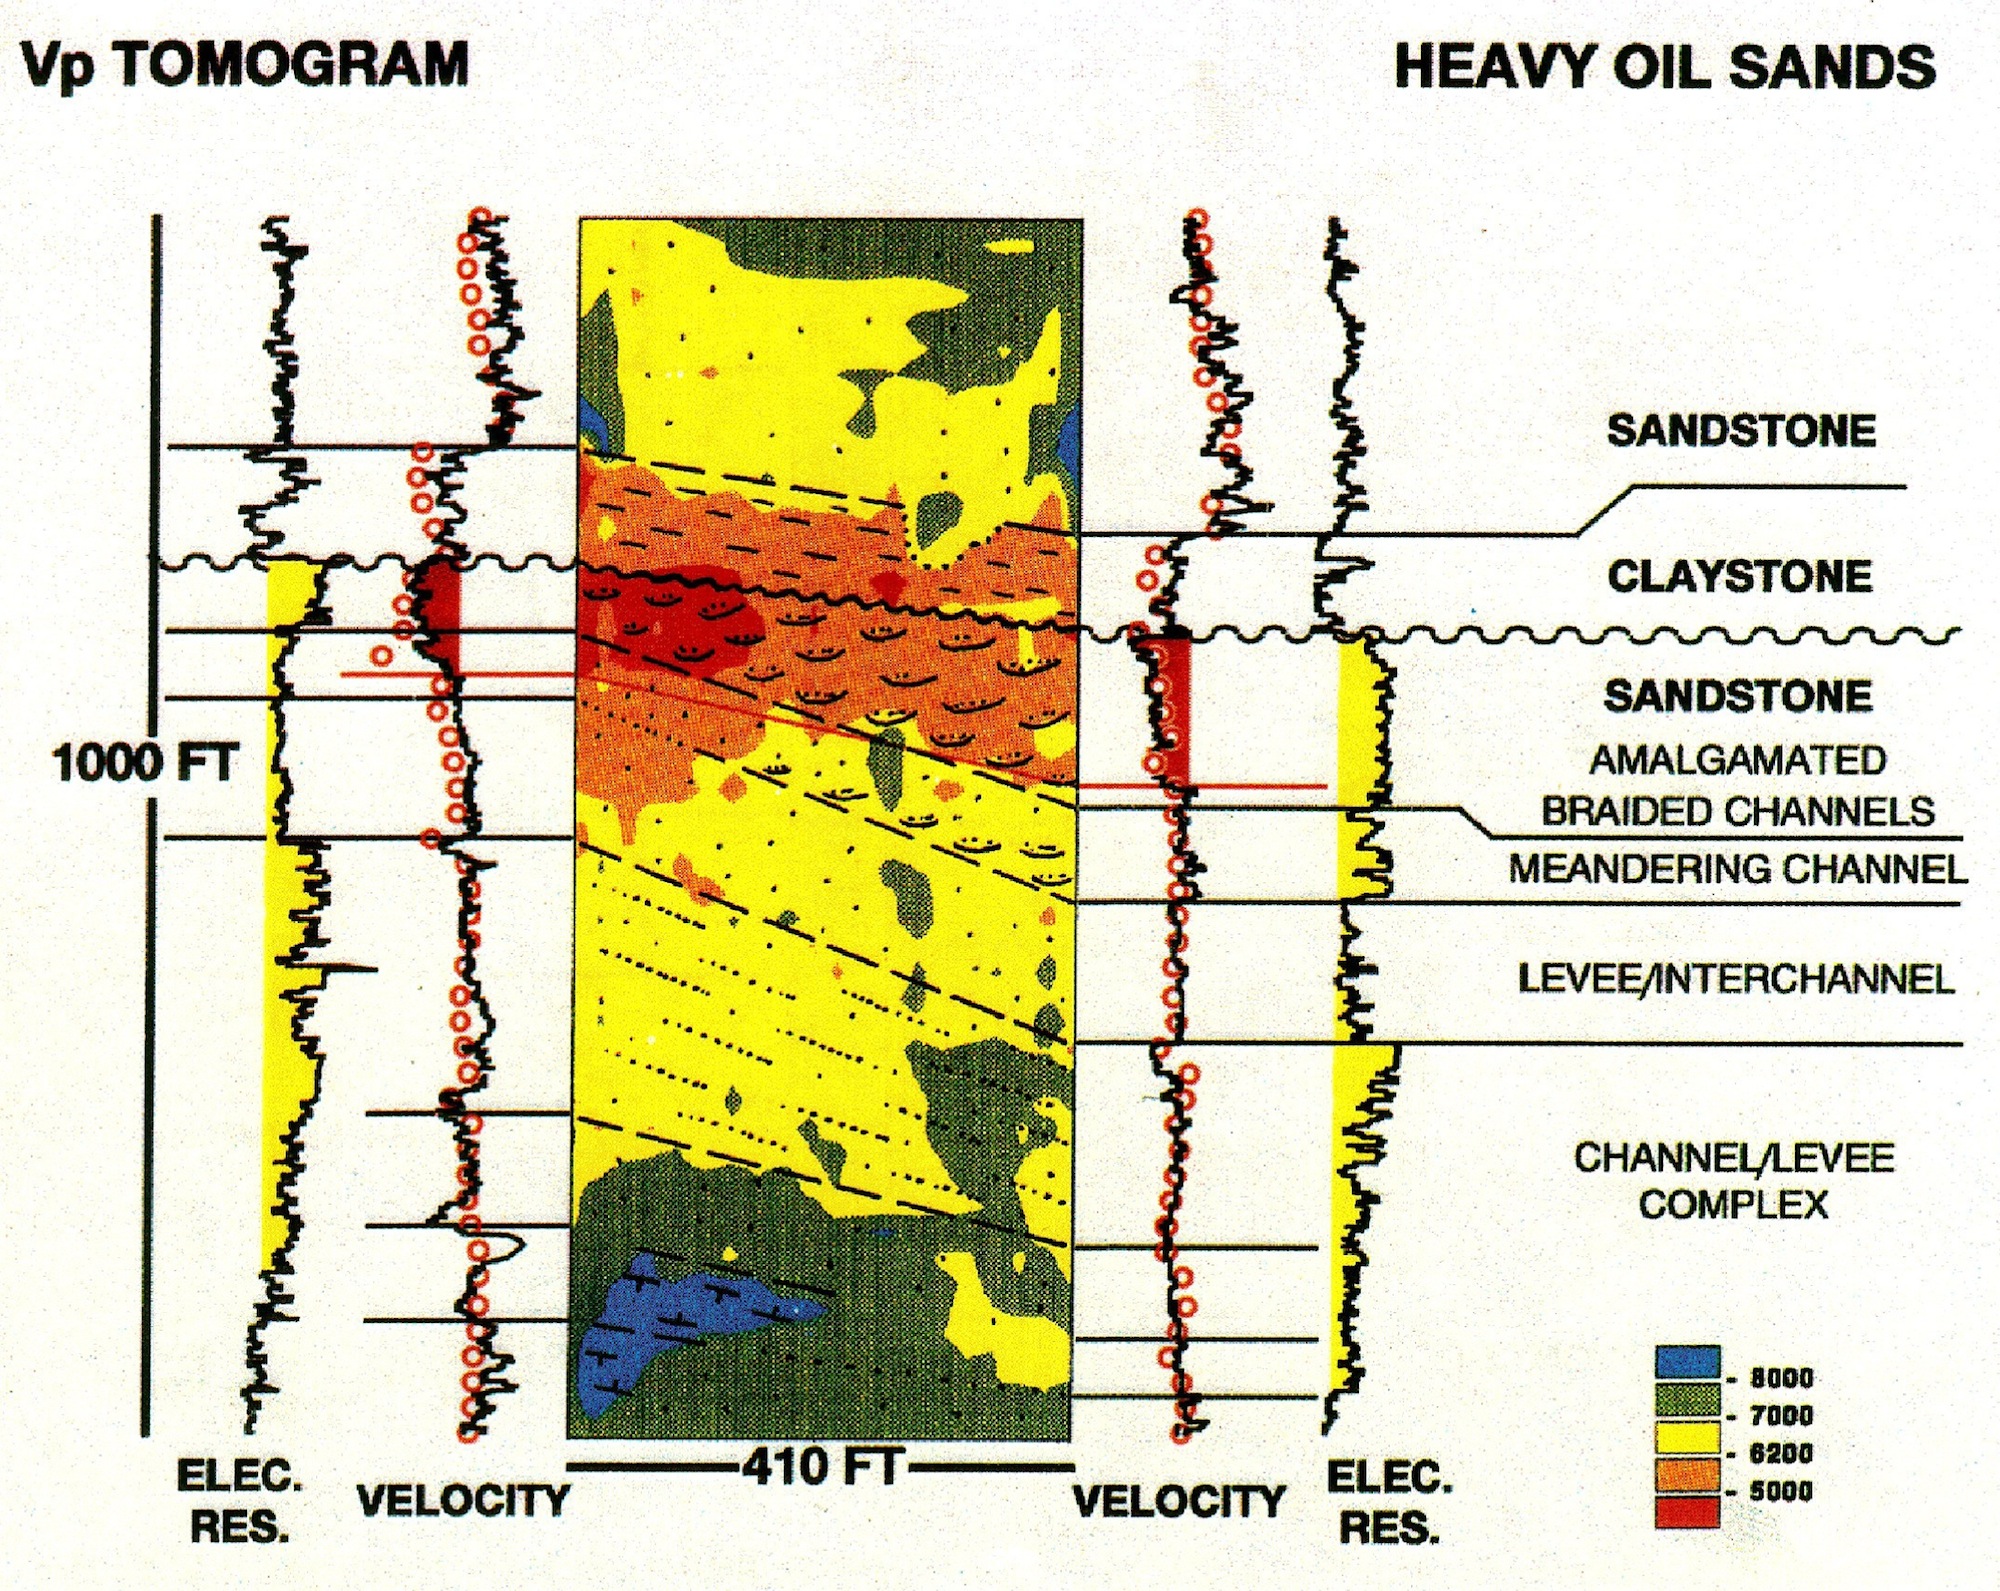
Integrated data display documenting cross-borehole tomography interpretation across thermal EOR project. Log-defined stratigraphic units and fluid saturation zones correlate with tomographic velocity fields and provide the basis for interpretation of reservoir and fluid properties. (From Justice et ai., 1990.). See Cross-borehole tomography in development geology.
File history
Click on a date/time to view the file as it appeared at that time.
| Date/Time | Thumbnail | Dimensions | User | Comment | |
|---|---|---|---|---|---|
| current | 17:12, 15 January 2014 | | 2,000 × 1,591 (1.16 MB) | Matt (talk | contribs) | Integrated data display documenting cross-borehole tomography interpretation across thermal EOR project. Log-defined stratigraphic units and fluid saturation zones correlate with tomographic velocity fields and provide the basis for interpretation of r... |
You cannot overwrite this file.
File usage
The following page uses this file: