File:Log-analysis-applications fig4.png
Jump to navigation
Jump to search

Size of this preview: 370 × 600 pixels. Other resolutions: 148 × 240 pixels | 1,548 × 2,509 pixels.
Original file (1,548 × 2,509 pixels, file size: 1.65 MB, MIME type: image/png)
Copyright of: Schlumberger. Faciolog is a trademark of Schlumberger
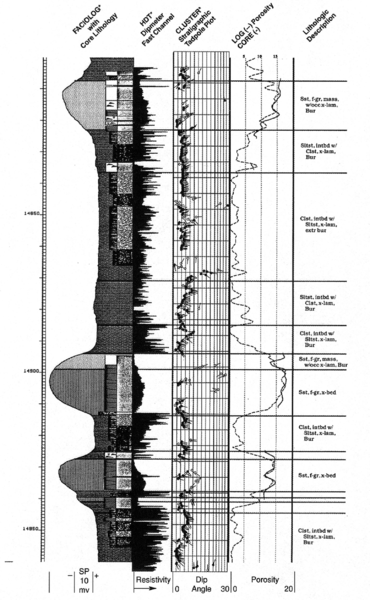
A traceplot displays trace values by their depth of occurrence. Users should carefully plan details of the display to maximize visual impact, legibility, amount of information conveyed, and any logical relationships in the data. (Traceplot. Copyright: Schlumberger. Faciolog is a trademark of Schlumberger.
File history
Click on a date/time to view the file as it appeared at that time.
| Date/Time | Thumbnail | Dimensions | User | Comment | |
|---|---|---|---|---|---|
| current | 16:36, 14 January 2014 | | 1,548 × 2,509 (1.65 MB) | Importer (talk | contribs) | {{copyright|Schlumberger. Faciolog is a trademark of Schlumberger}} A traceplot displays trace values by their depth of occurrence. Users should carefully plan details of the display to maximize visual impact, legibility, amount of information conveye... |
You cannot overwrite this file.
File usage
The following page uses this file: