File:Log-analysis-applications fig5.png
Jump to navigation
Jump to search

Size of this preview: 695 × 599 pixels. Other resolutions: 278 × 240 pixels | 929 × 801 pixels.
Original file (929 × 801 pixels, file size: 40 KB, MIME type: image/png)
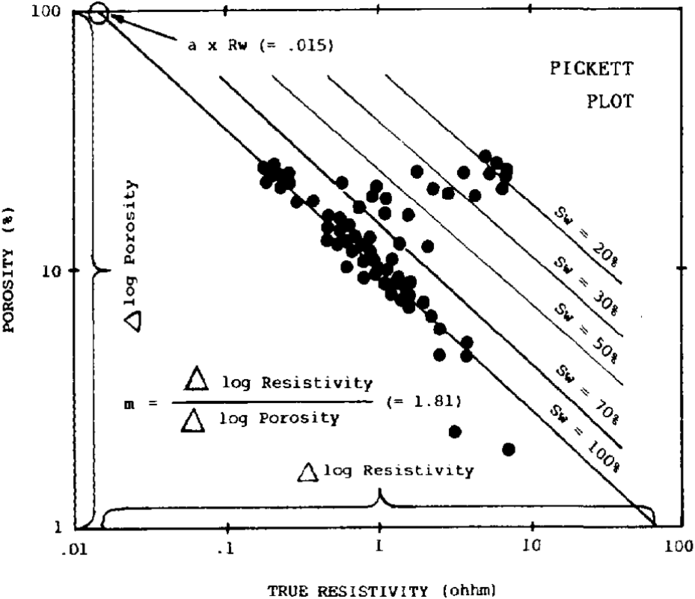
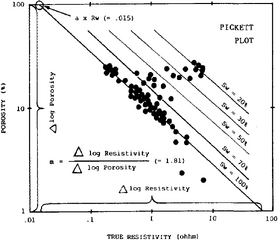
A Pickett plot allow users to interactively draw a line intersecting water wet points (<italic>S</italic>w = 100%). This line identifies the cementation exponent (<italic>m</italic>) and the product of a × <italic>R</italic><italic>w</italic> (empirical constant × formation water resistivity) and relates water saturation (<italic>S</italic>w) to porosity and true resistivity.
File history
Click on a date/time to view the file as it appeared at that time.
| Date/Time | Thumbnail | Dimensions | User | Comment | |
|---|---|---|---|---|---|
| current | 16:36, 14 January 2014 | | 929 × 801 (40 KB) | Importer (talk | contribs) | A Pickett plot allow users to interactively draw a line intersecting water wet points (<italic>S</italic><sub>w</sub> = 100%). This line identifies the cementation exponent (<italic>m</italic>) and the product of a × <italic>R</italic><sub><italic>w</... |
You cannot overwrite this file.
File usage
The following page uses this file: