File:Log-analysis-applications fig6.png
Jump to navigation
Jump to search

Size of this preview: 703 × 599 pixels. Other resolutions: 282 × 240 pixels | 894 × 762 pixels.
Original file (894 × 762 pixels, file size: 37 KB, MIME type: image/png)
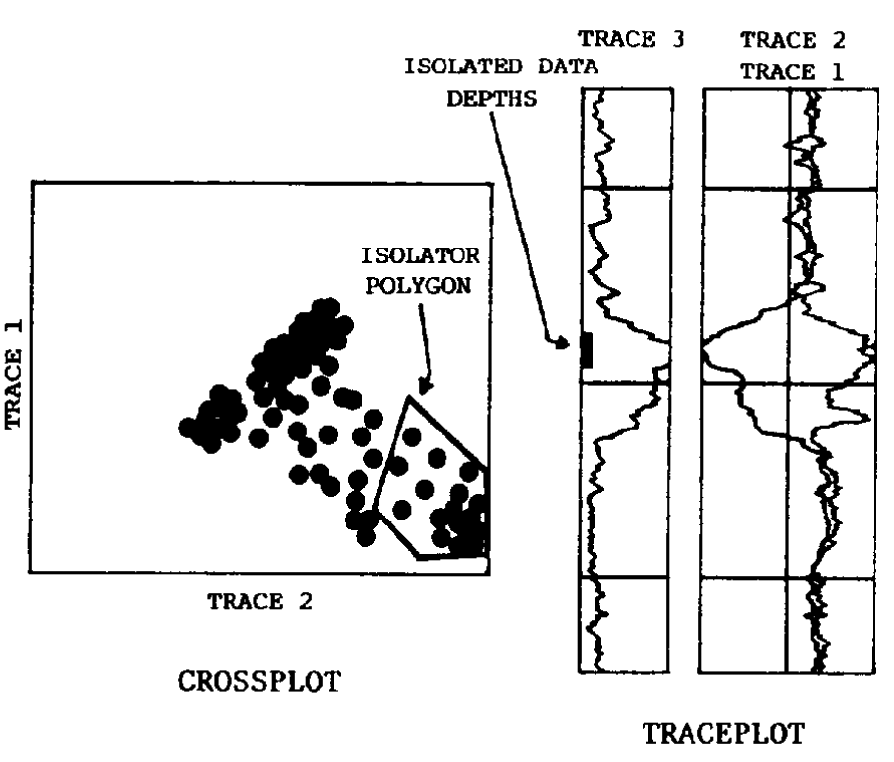
Dual plot contains crosspiot (featuring data isolator polygon) and traceplot. User interactively draws polygon on the screen, which identifies the enclosed data in the database. Corresponding depths are immediately marked on the traceplot, in this case with tic marks.
File history
Click on a date/time to view the file as it appeared at that time.
| Date/Time | Thumbnail | Dimensions | User | Comment | |
|---|---|---|---|---|---|
| current | 16:36, 14 January 2014 | | 894 × 762 (37 KB) | Importer (talk | contribs) | Dual plot contains crosspiot (featuring data isolator polygon) and traceplot. User interactively draws polygon on the screen, which identifies the enclosed data in the database. Corresponding depths are immediately marked on the traceplot, in this case... |
You cannot overwrite this file.
File usage
The following page uses this file: