File:Log-analysis-applications fig7.png
Jump to navigation
Jump to search

Size of this preview: 662 × 600 pixels. Other resolutions: 265 × 240 pixels | 925 × 838 pixels.
Original file (925 × 838 pixels, file size: 28 KB, MIME type: image/png)
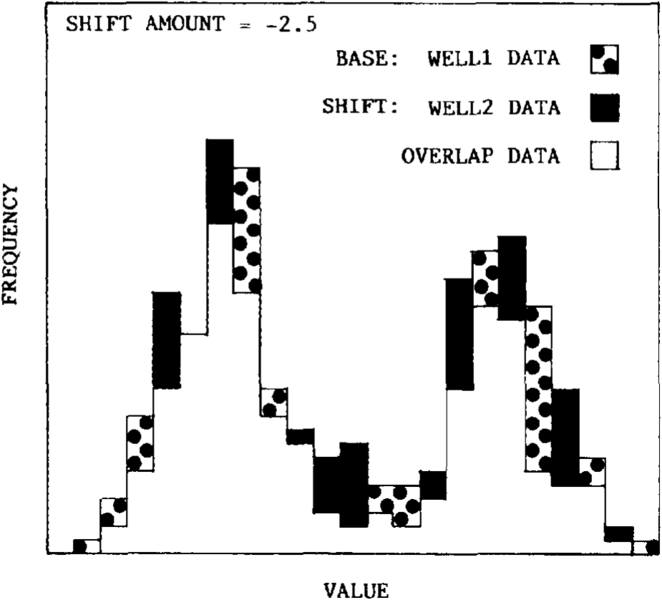
A two-well histogram allows users to compare data interactively from one well to another by shifting the second well's data across the base well on the screen. A visual best fit is usually satisfactory for determining the amount of normalization required.
File history
Click on a date/time to view the file as it appeared at that time.
| Date/Time | Thumbnail | Dimensions | User | Comment | |
|---|---|---|---|---|---|
| current | 16:36, 14 January 2014 | | 925 × 838 (28 KB) | Importer (talk | contribs) | A two-well histogram allows users to compare data interactively from one well to another by shifting the second well's data across the base well on the screen. A visual best fit is usually satisfactory for determining the amount of normalization requir... |
You cannot overwrite this file.
File usage
The following page uses this file: