File:Mem91BuoyanceForcesFig27.jpg
Jump to navigation
Jump to search
Size of this preview: 422 × 599 pixels. Other resolutions: 169 × 240 pixels | 600 × 852 pixels.
Original file (600 × 852 pixels, file size: 64 KB, MIME type: image/jpeg)
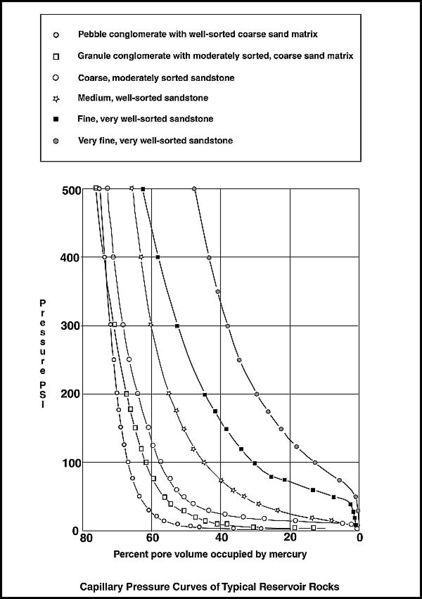
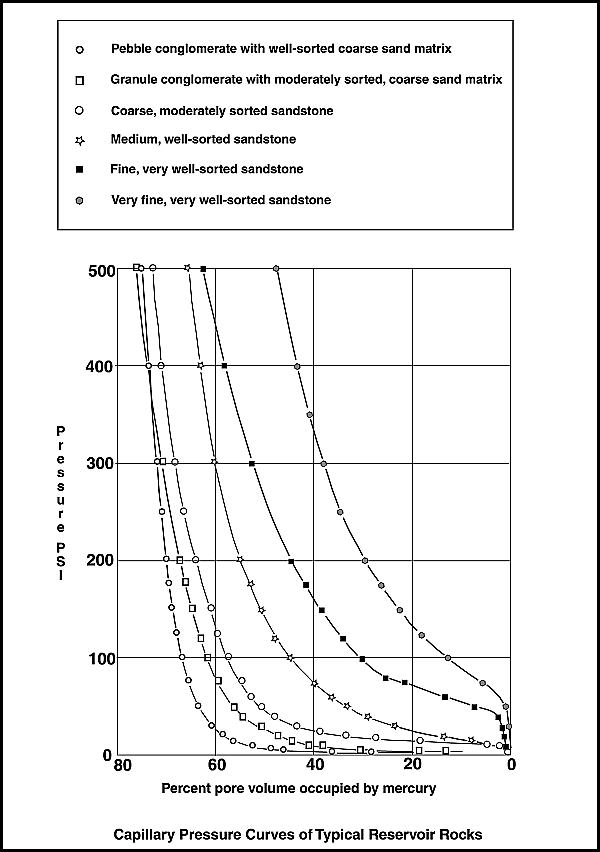
The shape of the curves on a capillary pressure plot reflects the grain sorting and the connection of pores and pore throats within the various rock types. The longer the plateau shown by the capillary curve, the better is the reservoir quality of the rock (from Sneider et al., 1977). Reprinted with permission from the Society of Petroleum Engineers.
File history
Click on a date/time to view the file as it appeared at that time.
| Date/Time | Thumbnail | Dimensions | User | Comment | |
|---|---|---|---|---|---|
| current | 17:18, 7 April 2014 | | 600 × 852 (64 KB) | Cwhitehurst (talk | contribs) | The shape of the curves on a capillary pressure plot reflects the grain sorting and the connection of pores and pore throats within the various rock types. The longer the plateau shown by the capillary curve, the better is the reservoir quality of the ... |
You cannot overwrite this file.
File usage
The following 2 pages use this file: