File:Mth16Ch7Figure7-1.jpg
Mth16Ch7Figure7-1.jpg (400 × 528 pixels, file size: 39 KB, MIME type: image/jpeg)
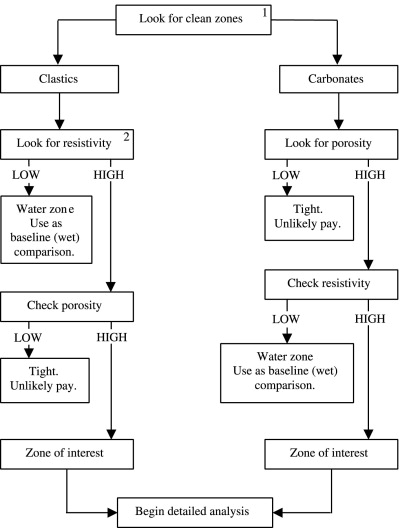
Flowchart for scanning logs to identify zones of interest (both pay and wet). The scanning flowchart has two paths, one for clastics and one for carbonates. Clastics: The resistivity log is the primary reconnaissance measurement because clastics tend to consist of reservoirs surrounded by shales whose resistivities vary gradually with depth. Differences in the fluid content of the reservoirs tend to produce reservoir resistivities that stand out against the relatively constant resistivity of the surrounding shales. Carbonates: Formation resistivities tend to vary widely with changing rock types, and commonly there are few shales against which to measure changes. In this case, the porosity log is the primary reconnaissance measurement. By first finding the porous zones, the zones with the capacity to hold fluids (of any type) can be identified. Using this scanning technique in combination with the neutron-density quick-look technique discussed in Chapter 4 of Basic Well Log Analysis, 2nd Edition, AAPG Methods in Exploration 16, (if those logs are available) allows one to identify lithology (and sometimes fluid type) in the course of identifying the zones of interest. 1 Zones that appear to be shales might be radioactive productive zones. 2 Shaly zones might produce oil or gas even if they have low resistivity.
File history
Click on a date/time to view the file as it appeared at that time.
| Date/Time | Thumbnail | Dimensions | User | Comment | |
|---|---|---|---|---|---|
| current | 16:08, 21 May 2014 | | 400 × 528 (39 KB) | Molyneux (talk | contribs) | Flowchart for scanning logs to identify zones of interest (both pay and wet). The scanning flowchart has two paths, one for clastics and one for carbonates. Clastics: The resistivity log is the primary reconnaissance measurement because clastics tend t... |
You cannot overwrite this file.
File usage
The following page uses this file: