File:Oil-and-condensate-analysis fig5.png
Jump to navigation
Jump to search
Size of this preview: 523 × 599 pixels. Other resolutions: 209 × 240 pixels | 1,942 × 2,226 pixels.
Original file (1,942 × 2,226 pixels, file size: 120 KB, MIME type: image/png)
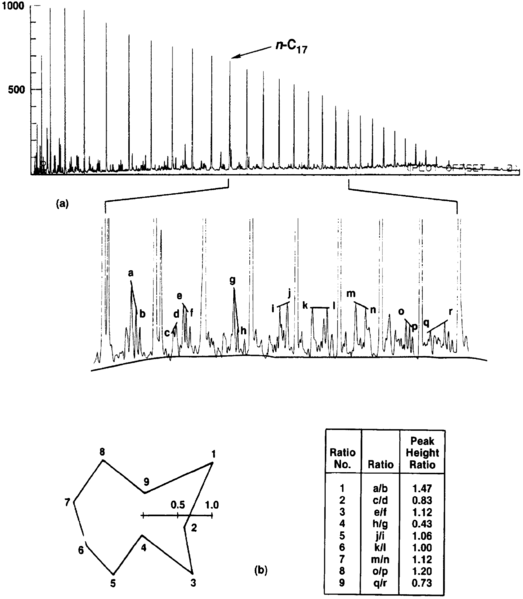
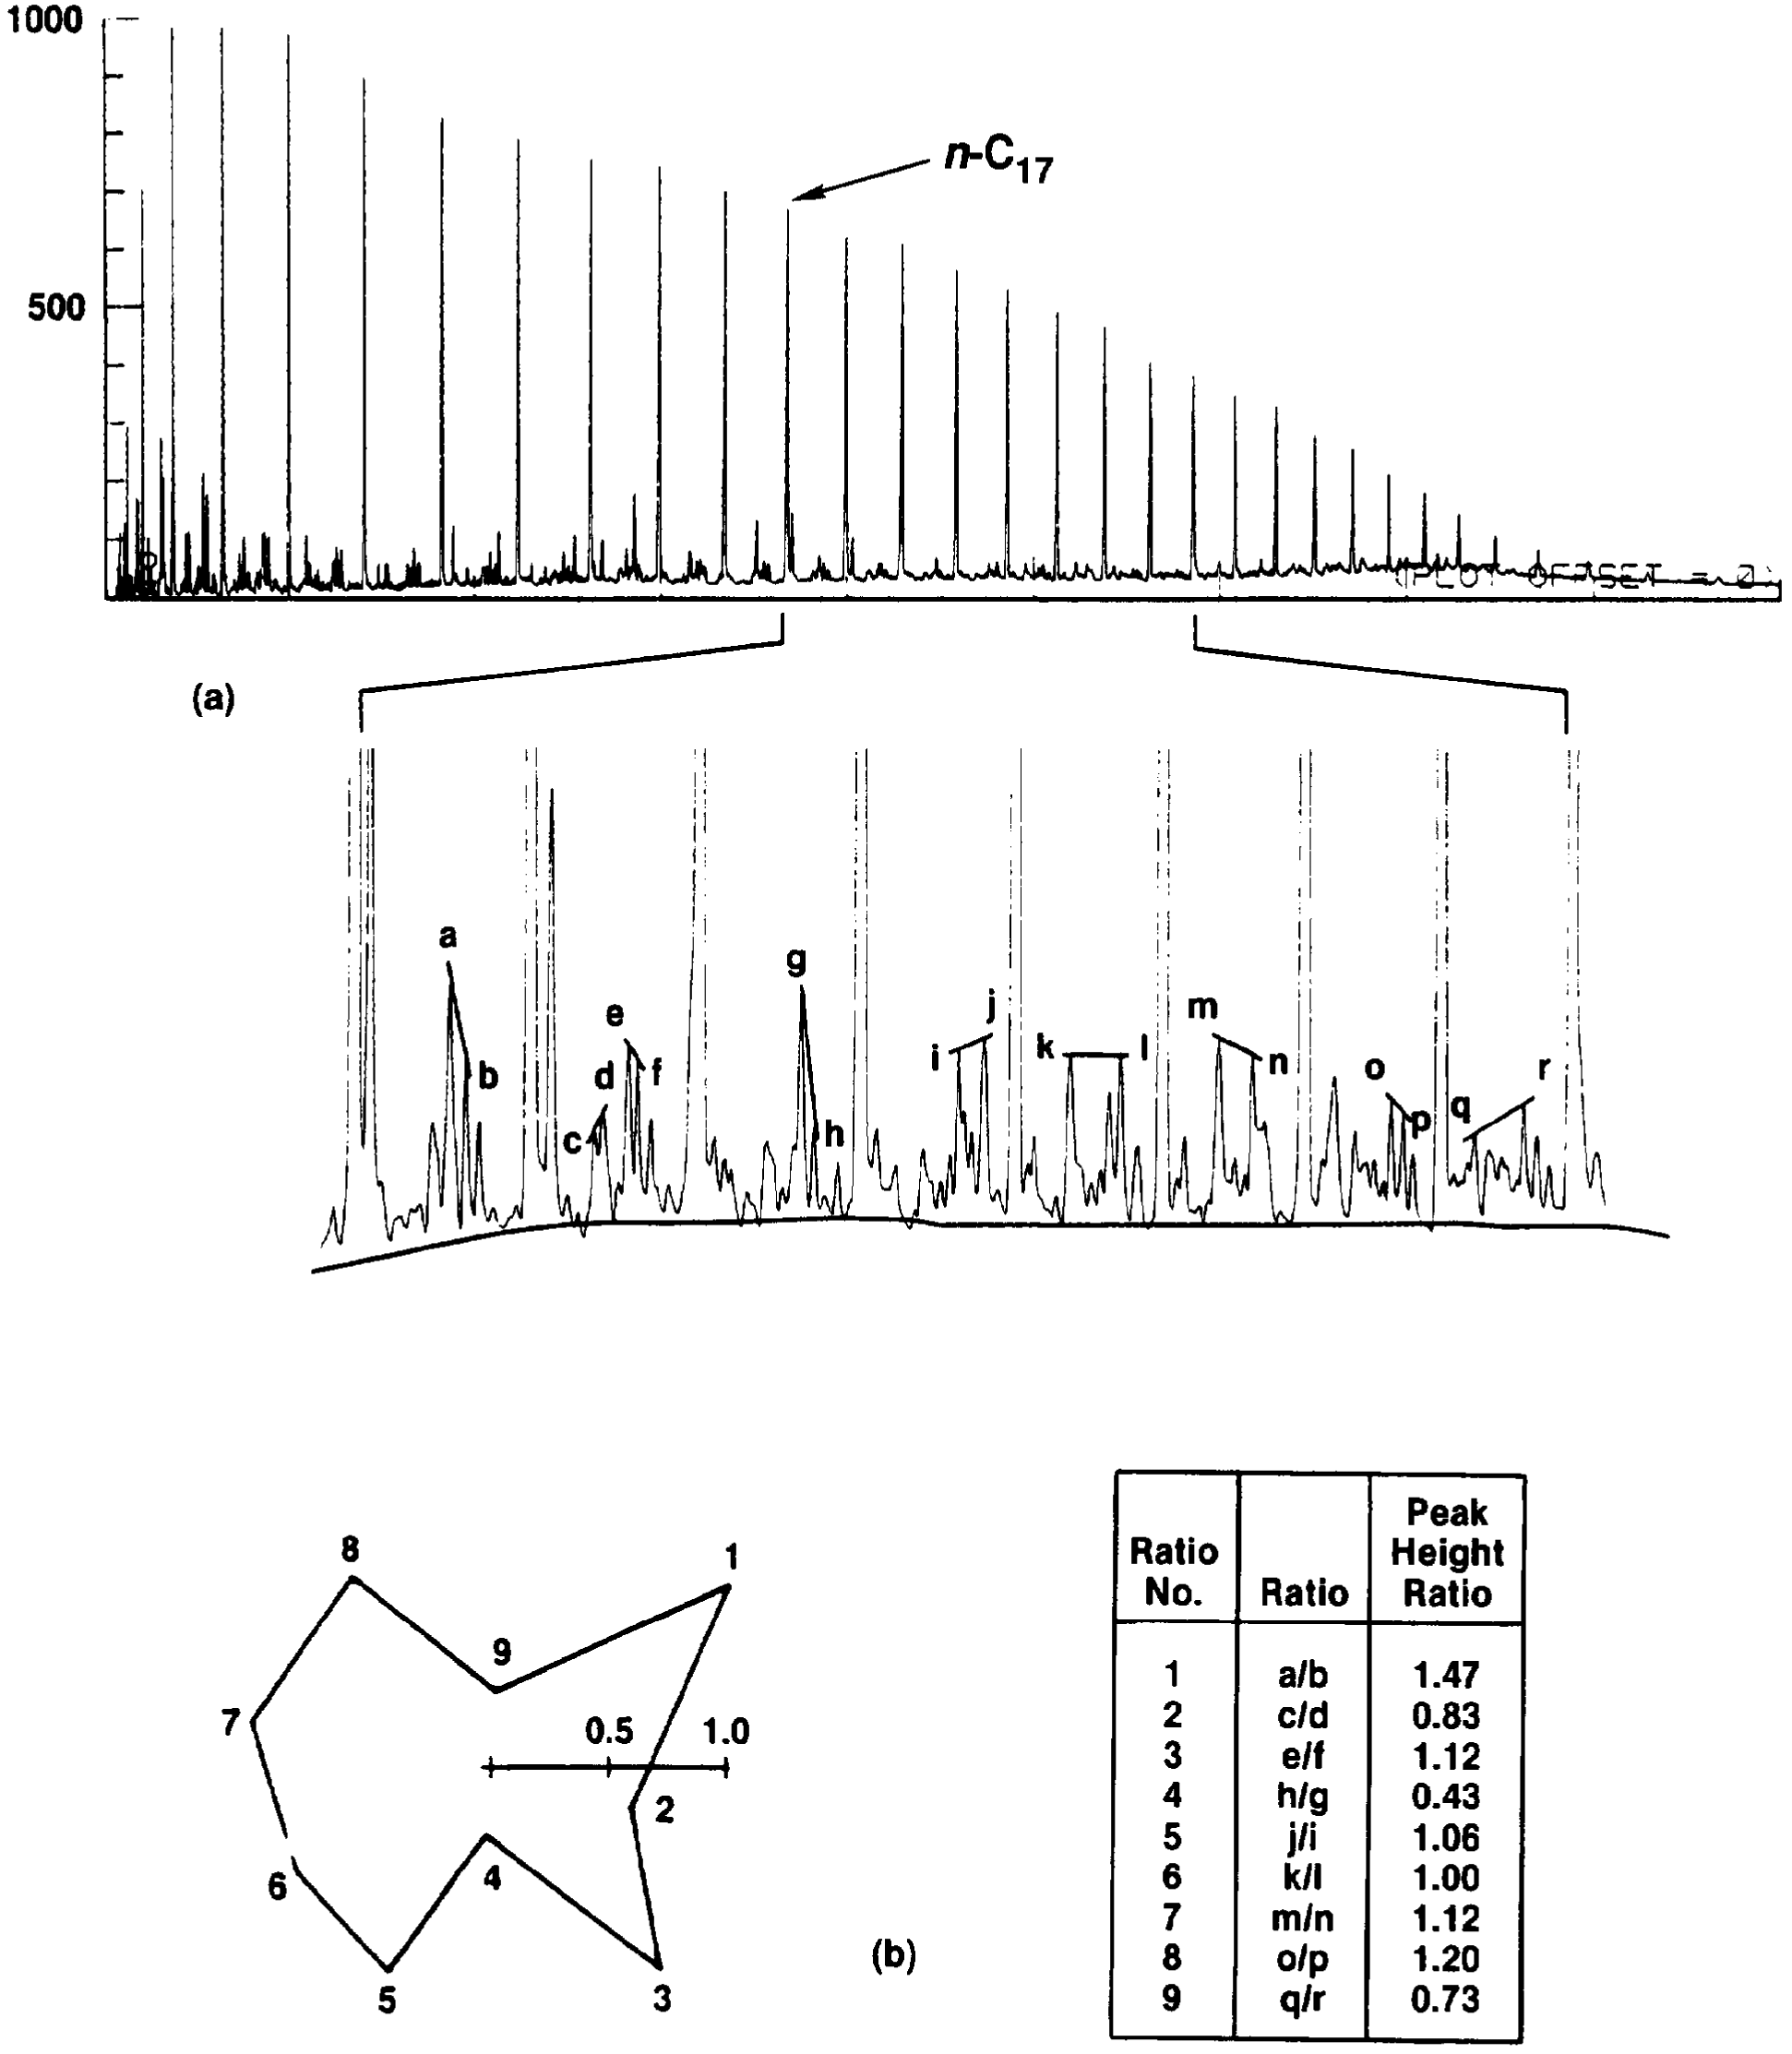
(a) Gas chromatographic data can be displayed as chromatograms at different attenuations, (b) as star diagrams of selected peak height ratios, or (c) as data tables of peak height ratios. The star diagram is a polar plot of the peak height ratio data from the table, which shows data from the chromatographic trace for peaks between <italic>n</italic>-C17 and <italic>n</italic>-C25.
File history
Click on a date/time to view the file as it appeared at that time.
| Date/Time | Thumbnail | Dimensions | User | Comment | |
|---|---|---|---|---|---|
| current | 17:17, 14 January 2014 | | 1,942 × 2,226 (120 KB) | Importer (talk | contribs) | (a) Gas chromatographic data can be displayed as chromatograms at different attenuations, (b) as star diagrams of selected peak height ratios, or (c) as data tables of peak height ratios. The star diagram is a polar plot of the peak height ratio data f... |
You cannot overwrite this file.
File usage
The following page uses this file: