File:Oilfield-water-analysis fig1.png
Jump to navigation
Jump to search

Size of this preview: 652 × 600 pixels. Other resolutions: 261 × 240 pixels | 896 × 824 pixels.
Original file (896 × 824 pixels, file size: 10 KB, MIME type: image/png)
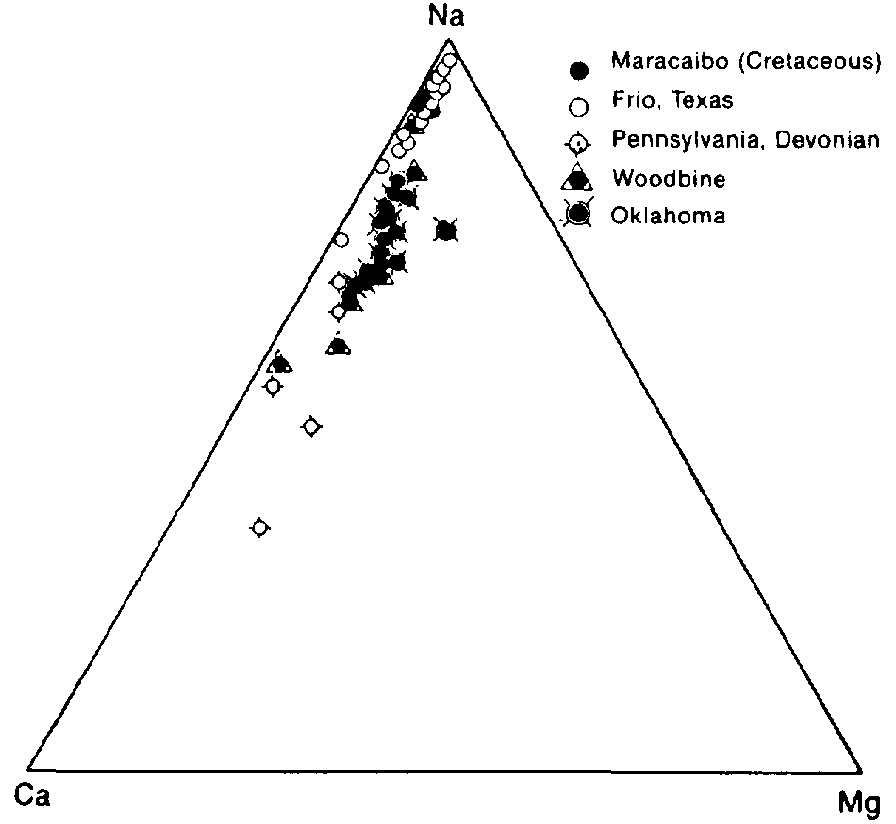
Triangular plot showing relative amounts of cations in typical oil field brines. Relative amount of sodium changes, but calcium is always about five times magnesium. (After Dickey, 1966.)
File history
Click on a date/time to view the file as it appeared at that time.
| Date/Time | Thumbnail | Dimensions | User | Comment | |
|---|---|---|---|---|---|
| current | 17:24, 14 January 2014 | | 896 × 824 (10 KB) | Importer (talk | contribs) | Triangular plot showing relative amounts of cations in typical oil field brines. Relative amount of sodium changes, but calcium is always about five times magnesium. (After Dickey, 1966.) Category:Laboratory methods |
You cannot overwrite this file.
File usage
The following page uses this file: