File:Overview-of-routine-core-analysis fig2.png
Jump to navigation
Jump to search

Size of this preview: 576 × 599 pixels. Other resolutions: 231 × 240 pixels | 945 × 983 pixels.
Original file (945 × 983 pixels, file size: 19 KB, MIME type: image/png)
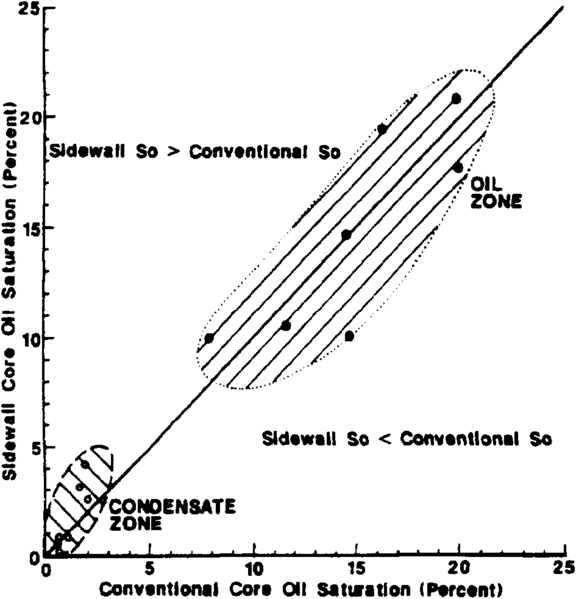
Comparison of saturation data (Jenkins, 1987) indicate that sidewall cores from gas condensate zones may have measured oil saturation values that are 2% higher than conventional core samples. In oil zones the relationship is less clear. The agreement between oil saturation values In sidewall and conventional cores may vary with such oil characteristics as API gravity.
File history
Click on a date/time to view the file as it appeared at that time.
| Date/Time | Thumbnail | Dimensions | User | Comment | |
|---|---|---|---|---|---|
| current | 22:39, 13 January 2014 | | 945 × 983 (19 KB) | Importer (talk | contribs) | Comparison of saturation data (Jenkins, 1987) indicate that sidewall cores from gas condensate zones may have measured oil saturation values that are 2% higher than conventional core samples. In oil zones the relationship is less clear. The agreement b... |
You cannot overwrite this file.
File usage
The following page uses this file: