File:Subsurface-maps fig3.png
Jump to navigation
Jump to search

Size of this preview: 800 × 571 pixels. Other resolutions: 320 × 229 pixels | 931 × 665 pixels.
Original file (931 × 665 pixels, file size: 79 KB, MIME type: image/png)
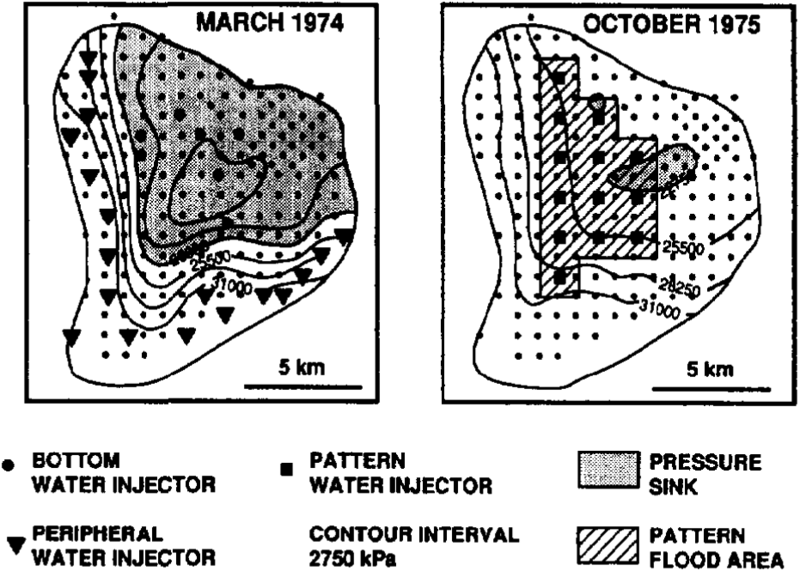
Map of pressure response to pattern flood, Judy Creek field, western Canada, 1974 and 1975. Contour interval is 2750 kPa. (After Jardine and Wilshart, 1987.)
File history
Click on a date/time to view the file as it appeared at that time.
| Date/Time | Thumbnail | Dimensions | User | Comment | |
|---|---|---|---|---|---|
| current | 20:42, 14 January 2014 | | 931 × 665 (79 KB) | Importer (talk | contribs) | Map of pressure response to pattern flood, Judy Creek field, western Canada, 1974 and 1975. Contour interval is 2750 kPa. (After Jardine and Wilshart, 1987.) Category:Geological methods |
You cannot overwrite this file.
File usage
The following page uses this file: