Formation fluid pressure from drill stem tests
| Exploring for Oil and Gas Traps | |

| |
| Series | Treatise in Petroleum Geology |
|---|---|
| Part | Critical elements of the petroleum system |
| Chapter | Formation fluid pressure and its application |
| Author | Edward A. Beaumont, Forrest Fiedler |
| Link | Web page |
| Store | AAPG Store |
A drill-stem test, or DST, is the most common method to measure reservoir pressure. DSTs are the most reliable reservoir pressure measurement method if sufficient time elapses during the test for the higher formation pressure to equilibrate with the lower borehole pressure. Pressures often must be extrapolated. Irregular boreholes cause tool problems, and assessing the reliability of a DST is often more of an art than a science.
Types of periods during a DST[edit]

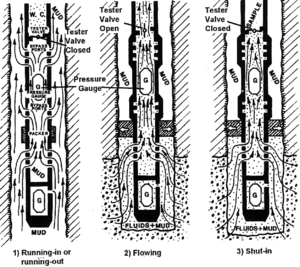
There are three major types of periods during a typical DST:
- During run-in or run-out periods, drilling fluid flows through ports in the tool wall and pressure gauges respond to the weight of the drilling fluid column. The tester valve is closed.
- During flowing periods, an interval of the borehole is sealed off from the rest of the borehole by one (bottom hole) or two (straddle) inflatable packers. The tester valve is opened, creating a pressure drop in the tool which sucks fluids into the tool and drillpipe string. Recovered volumes of oil, gas, water, or drilling mud are recorded.
- During shut-in periods, the packer(s) is still inflated and the tester valve is closed. Ideally, pressure in the closed tool gradually builds up until it reaches equilibrium with the pressure of the isolated formation.
Figure 1 shows a typical DST tool, the configurations of the tool during a DST, and the periods of a DST.
A DST plot[edit]
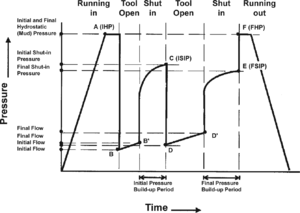
During a DST, pressure is continuously recorded against time. The record begins as the DST tool is lowered down the borehole and ends when the tool returns to the surface. Figure 2 is a DST plot, showing the various pressures recorded during the different DST periods.
Point A is the initial hydrostatic pressure (IHP), the pressure exerted by the mud column in the borehole at the depth where the recorder is located.
Points B to B′ are the pressures recorded when the tool is opened up to the formation and fluids flow up the drillpipe. B is the initial flowing pressure; B′ is the final flowing pressure.
Point C is the initial shut-in pressure (ISIP). It is measured while the tool is closed. The rapid expulsion of fluid from the reservoir during the preceding flow period causes reservoir pressure to drop near the wellbore. ISIP is the pressure in the reservoir after the first shut-in period. The duration of this shut-in time is determined by the operator and should be planned in advance of the test.
Points D to D′ are the pressures recorded during the next flow period. This flow period (and subsequent flow periods, in some cases) usually lasts longer than the first in order to test the productivity of the reservoir.
Point E is the final shut-in period (FSIP). It records the pressure in the reservoir after the last shut-in period.
Point F is the final hydrostatic pressure (FHP), the pressure of the mud column at the test depth after the test was performed. It should match the IHP within 5 psi as a check of the tool's accuracy (assuming the packers did not leak).
Extrapolating true pressures[edit]

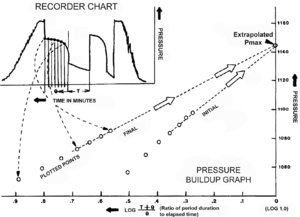
DST pressures may not be reliable because the tool is not shut in long enough for pressure to stabilize at final reservoir pressure. A graphical procedure devised by Horner[2] infers the true reservoir pressure by extrapolating the shut-in periods to infinity.
Figure 3 is an example showing how pressure is extrapolated from ISIP and FSIP on a Horner plot (pressure vs. psuedo or Horner time, or (T + ΔT)/ΔT
DST pressures from scout tickets[edit]
Scout tickets are a common source of fluid pressure data. They list the duration of various episodes, the pressures measured during the episode, and the amount and types of fluids recovered. How reliable are scout ticket data and which pressure should one use for formation fluid pressure? As an example, Dahlberg[1] studies 27 DSTs for formation pressure reliability. He extrapolates the reported pressures to true formation pressure using a Horner plot and finds that pressures must be increased an average of 10 psi.
During a DST, two pressures measure the fluid pressure of the formation being tested: the ISIP and the FSIP. The higher is usually closest to true formation fluid pressure. In many cases, it is the ISIP.
See also[edit]
References[edit]
- ↑ 1.0 1.1 1.2 Dahlberg, E., C., 1994, Applied Hydrodynamics in Petroleum Exploration, 2nd ed.: New York, Springer-Verlag, 295 p. Excellent subsurface fluid pressure reference. Covers hydrodynamic and static fluids.
- ↑ Horner, D. R., 1951, Pressure build-up in wells: Proceedings of the Third World Petroleum Congress, The Hague, Section II, p. 503–521.
