Gas chromatography/mass spectrometry (GC/MS): procedures
| Exploring for Oil and Gas Traps | |

| |
| Series | Treatise in Petroleum Geology |
|---|---|
| Part | Critical elements of the petroleum system |
| Chapter | Oil–oil and oil–source rock correlations |
| Author | Douglas W. Waples, Joseph A. Curiale |
| Link | Web page |
| Store | AAPG Store |
GC/MS is a technique used to identify and quantify those compounds present in small concentrations that cannot be adequately separated, identified, and quantified using gas chromatography.
Selected ion monitoring (SIM)
Traditionally, the most common application of GC/MS in exploration has been selected ion monitoring (SIM). In this technique, a single ion is monitored at a time, permitting one class of compound to be separated and analyzed apart from all others. In a single run several different ions can be monitored, allowing analysis of many classes of compounds.
Example of SIM
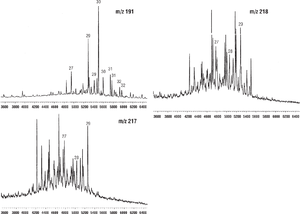
Figure 1 shows three SIM mass chromatograms for a single oil sample. The top left chromatogram show the m/z 191 chromatogram, in which the only compounds are those having a fragment ion with a mass of 191 daltons. (The value m/z is the mass of the ion divided by its charge.) The bottom left chromatogram shows the compounds yielding an m/z 217 fragment in the mass spectrometer, while the top right chromatogram shows those compounds that give an m/z 218 fragment. The 217 and 218 mass chromatograms are very similar because both are derived mainly from steranes. The differences in relative intensity reflect the tendency of some types of steranes to give more 217 daughter ions and others to give more 218. These tendencies are due to structural differences among different families of steranes and are useful in themselves.
Common ions
The table below lists common ions and the aliphatic hydrocarbon compound classes for which they are most commonly used.
| Ion (m/z) | Compound class monitored |
|---|---|
| 123 | Diterpanes, sesquiterpanes |
| 125 | Carotanes |
| 177 | Demethylated triterpanes |
| 191 | Triterpanes, bicadinanes, tricyclic diterpanes (cheilanthanes) |
| 217 | Steranes, bicadinanes |
| 218 | ββ steranes |
| 231 | 4-methylsteranes |
| 259 | Diasteranes |
Metastable reaction monitoring (MRM)
Although SIM has a long and valuable history in analyzing complex mixtures of biomarkers, it is not always able to separate all the compounds we would wish. To achieve a more detailed separation and more accurate identification and quantification, particularly of steranes, different kinds of mass spectrometers can be used, resulting in methods such as GC/MS/MS and metastable reaction monitoring (MRM). In these techniques we look at the products of each molecule separately so that we know not only the mass of the fragment ion but also the parent from which it came.
For example, in data on steranes obtained from MRM, instead of a single trace that includes all the steranes, there is a series of traces, each dedicated to a single precursor compound. Thus, one trace monitors all the steranes with 29 carbon atoms, another those with 28 carbons, and so on.
Example of MRM

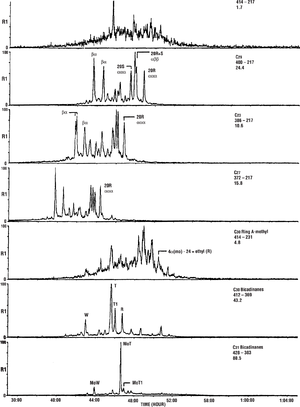
Figure 2 shows MRM output for steranes from the Lufa oil seep in Papua New Guinea. The same sample was also discussed in Data obtained by gas chromatography. Each fragmentogram monitors the transformation of a particular molecular ion to the designated daughter ion. The top four traces monitor conversion to the m/z 217 fragment ion from four different sizes of original sterane molecules. The top chromatogram represents the decomposition of methylsteranes (molecular weight = 414 daltons), and through its very low relative intensity at 100% scale (1.7) shows these compounds to be present in minor amounts. The next three chromatograms are for the C29, C28, and C27 steranes, respectively. From the relative concentrations (24.4, 10.6, and 15.8) of these fragments, we see the C29 species is dominant. The fifth chromatogram monitors 4-methylsteranes, which in this sample represent only minor components. The last two fragmentograms, in contrast, monitor two different bicadinane species.
The presence of bicadinanes in this sample further limits the source rock age for this oleanane-bearing oil.
See also
- Molecular parameter data for oil–oil and oil–source rock correlations
- Gas chromatography: data obtained
- Organic compounds: environmental indicators
- Gas chromatography/mass spectrometry (GC/MS): examples of correlations
- Gas chromatography/mass spectrometry (GC/MS): limitations
- High-performance liquid chromatography
References
- ↑ Murray, A. P., R. E. Summons, J. Bradshaw, and B. Pawih, 1993, Cenozoic oil in Papua New Guinea—evidence from geochemical analysis of two newly discovered seeps, in G. J. Carman and Z. Carman, eds., Petroleum Exploration and Development in Papua New Guinea: Proceedings of the Second PNG Petroleum Convention, Australian Geological Survey, p. 489–498.
