Recognizing stacked depositional sequences from well data
| Exploring for Oil and Gas Traps | |

| |
| Series | Treatise in Petroleum Geology |
|---|---|
| Part | Critical elements of the petroleum system |
| Chapter | Sedimentary basin analysis |
| Author | John M. Armentrout |
| Link | Web page |
| Store | AAPG Store |
Stacked depositional sequences can be recognized in well data using
- variations in well log response
- biostratigraphic data such as microfossil abundance patterns and biofacies distribution
Armentrout[1] discusses integration of these data sets.
Building regional log cross sections[edit]
Regional stratigraphic well-log cross sections form the foundation for many basin studies. They give a regional view of basin stratigraphy and can be integrated with seismic and biostratigraphic data. The list below outlines the steps for building regional well-log cross sections.
- Build a grid of well-log sections that crosses the entire basin, either along depositional dip or depositional strike. Use as many wells as practical. Where available, add measured sections and core descriptions to the grid.
- Correlate cross sections. Look for unconformities and flooding surfaces.
- Tie the correlations from depositional-dip sections to depositional-strike sections.
- Confirm correlations on seismic reflection profiles.
Biostratigraphic patterns[edit]
Using chronostratigraphically significant bioevents as defined by microfossil extinction events and abundance patterns, local cycles of transgression and regression can be correlated from well to well, providing a high-resolution calibration of depositional cyclicity. Patterns of relative dilution vs. concentration of fossils that correlate over a significant geographic area, such as a large portion of a basin margin, can be interpreted as reflecting cycles of regional transgression and regression rather than local lateral shifting of sediment input points.
Stratigraphic intervals rich in calcareous nannoplankton and foraminiferal fossils and having maximum gamma-ray values are interpreted to correlate with condensed depositional intervals deposited during relative sediment starvation related to transgression.[2] Intervals devoid of fossils or having low abundance values, often associated with sandy lithofacies, can be interpreted as deposited during relative high rates of accumulation related to progradation of the sediment supply into the area of the well, marking a phase of regression. Biofacies are interpreted using benthic foraminiferal assemblages indicative of water mass conditions.[3][4][5]
GOM basin example[edit]
In the GOM basin, variations in well-log response and biofacies distribution are analyzed for recognition of stacked depositional sequences. The gamma-ray log display provides a measure of sediment type, with curve deflections to the left suggesting increased sand content while high values to the right indicate increases in clay content. Use of multiple logs, especially spontaneous potential, resistivity, density, and velocity logs calibrated by well-cutting descriptions and formation microscanner displays, provides a data set for reliable rock type identification. The figure below illustrates an interpretation template for log motif analysis.
Patterns of forestepping vs. backstepping log-motif funnels can define transgressive vs. regressive depositional trends and candidate systems tracts and sequences. Vail and Wornardt[6] and Armentrout et al.[7] detail the process.
GOM basin example chart[edit]
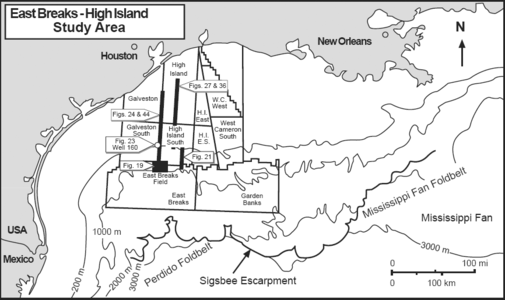
Figure 1 Map of the study area, showing the named offshore exploration areas and bathymetry. It also shows the locations of the East Breaks 160-161 field, illus- trated seismic profiles and a reference well.
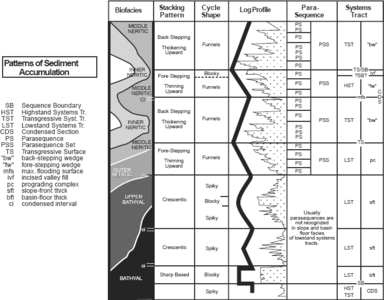
Figure 2 Interpretation template for log motif analysis. From Armentrout et al.[7] Courtesy The Geological Society of London.
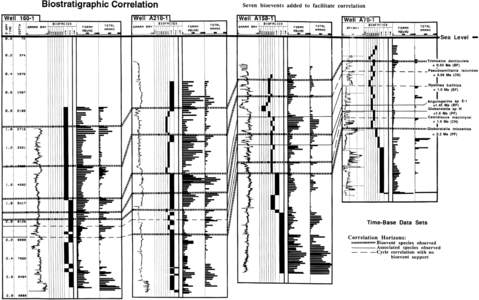
Figure 4 Candidates for maximum flooding surfaces are identified by abundance peaks in both foraminifera and nannoplankton and by extinction events known to be associated with regionally significant maximum transgressions. From Armentrout.[1] Courtesy Springer-Verlag and The Geological Society of London.


The histogram patterns of foraminiferal and calcareous nannoplankton abundance for the South Galveston Mobil A-158 #3 well are shown in Figure 3. The histogram is based on a detailed checklist of the relative abundance of each species of fossil in each well-cutting sample.[8] Display of this data in two-way time facilitates integration with seismic reflection profiles using the synthetic seismogram to match the well data with the seismic reflection profile at the well site. Patterns of shallow vs. deep biofacies and fossil abundance (i.e., concentration vs. dilution) can be correlated with progradation of sandstone vs. mudstone interpreted from wireline log patterns. Bioevents (abbreviated acronyms such as 2B and SG) and faunal discontinuity events (abbreviated FDA-3 and FDA-4) provide correlation horizons between which the abundance patterns provide additional events for correlation.[5]
In the histogram in Figure 3 (see Figure 1 for well location), the foraminiferal abundance scale is 0-1000 specimens and the nannoplankton abundance scale is 0-800 specimens. Biofacies include inner neritic (IN, 0-50 m), middle neritic (MN, 50-100 m), outer neritic (ON, 100-200 m), upper bathyal (UPPB, 200-500 m), middle bathyal (MDLB, 500-1000 m), and lower bathyal (LOWB, 1000–2000 m). This figure is the leftmost (southern) well panel in Figure 4. The wireline log (gamma ray) motif patterns (Figure 2), biostratigraphic abundance events, and extinction datums provide correlation events.
Biostratigraphic correlation of stacked sequences[edit]
The well correlation section on the next page is an example of using high-resolution biostratigraphic correlation to recognize depositional successions within stacked depositional sequences. In some basins containing nondescript fill that lacks unique marker beds, like the Gulf of Mexico, high-resolution biostratigraphic correlation is the best method for subdividing basin fill into sequences and systems tracts.[9][10][11]
The four wells in the cross section are in a depositionally dip-oriented transect.[1] The correlation horizons, based on seven chronostratigraphically significant bioevents (mostly extinction events), partition the strata into age-correlative intervals.[8] Most of the chronostratigraphically significant bioevents occur in association with maximum fossil abundance, resulting in the interpretation of these correlation horizons as maximum flooding surface-condensed section data.[10][11][8][12][13][14][1]
Each well panel is formatted the same as Figure 3. The foraminiferal (left histogram) and calcareous nannoplankton (right histogram) abundance patterns of each well are very similar. Biostratigraphic correlation horizons (horizontal lines) provide ties between the wells, facilitating comparison between the abundance patterns and biofacies variations within each chronostratigraphic interval. Each correlation was checked against correlations independently constructed using a regional grid of seismic reflection profiles.
Identifying sequence in the GOB basin example[edit]
In Figure 4, candidates for maximum flooding surfaces are identified by abundance peaks in both foraminifera and nannoplankton and by extinction events known to be associated with regionally significant maximum transgressions.[8][12][13][14] Sequence boundary candidates occur between the maximum flooding surfaces and are identified by low abundance of fossils and by wireline log patterns. The northern wells (right) are rich in sand deposited in shallow water (neritic biofacies); sequence boundaries are likely to occur at the top of forestepping parasequence sets. The southern wells (left) are sand-poor shale deposited in deep water (bathyal biofacies); sequence boundaries are likely to occur at or slightly below flat-based blocky sands and at faunal abundance minima.
See also[edit]
- East Breaks depositional sequence
- Definitions of depositional system elements
- Identifying depositional sequences
- Identifying depositional sequences in seismic sections
- Identifying depositional sequences from biostratigraphic data
- Recognizing stacked depositional sequences in seismic profiles
References[edit]
- ↑ 1.0 1.1 1.2 1.3 1.4 Armentrout, J., M., 1996, High-resolution sequence biostratigraphy: examples from the Gulf of Mexico Plio–Pleistocene, in Howell, J., Aiken, J., eds., High Resolution Sequence stratigraphy: Innovations and Applications: The Geological Society of London Special Publication 104, p. 65–86.
- ↑ Loutit, T., S., Hardenbol, J., Vail, P., R., Baum, G., R., 1988, Condensed sections: the key to age determination and correlation of continental margin sequences: SEPM Special Publication 42, p. 183–213.
- ↑ Tipsword, H., L., J., Setzer, F., M., Smith, F., L. Jr., 1966, Interpretation of depositional environment in Gulf Coast exploration from paleoecology and related stratigraphy: Gulf Coast Assoc. of Geological Societies Transactions, vol. 16, p. 119–130.
- ↑ Culver, S., J., 1988, New foraminiferal depth zonation of the northwestern Gulf of Mexico: Palaios, vol. 3, p. 69–85., 10., 2307/3514545
- ↑ 5.0 5.1 5.2 Armentrout, J., M., 1991, Paleontological constraints on depositional modeling: examples of integration of biostratigraphy and seismic stratigraphy, Pliocene–Pleistocene, Gulf of Mexico, in Weimer, P., Link, M., H., eds., Seismic Facies and Sedimentary Processes of Submarine Fans and Turbidite Systems: New York, Springer-Verlag, p. 137–170.
- ↑ Vail, P., R., Wornardt, W., W., 1990, Well log seismic stratigraphy: a new tool for exploration in the '90s: Proceedings, Gulf Coast Section SEPM 11th Annual Research conference, p. 379–388.
- ↑ 7.0 7.1 Armentrout, J. M., S. J. Malacek, L. B. Fearn, C. E. Sheppard, P. H. Naylor, A. W. Miles, R. J. Desmarais, and R. E. Dunay, 1993, Log-motive analysis of Paleogene depositional systems tracts, central and northern North Sea: Defined by sequence stratigraphic analysis in J. R. Parker, ed., Petroleum Geology of Northwest Europe: Proceedings of the 4th Conference, The Geological Society of London, p. 45-57.
- ↑ 8.0 8.1 8.2 8.3 Armentrout, J., M., Clement, J., F., 1990, Biostratigraphic calibration of depositional cycles: a case study in High Island–Galveston–East Breaks areas, offshore Texas: Proceedings, Gulf Coast Section SEPM 11th Annual Research Conference, p. 21–51.
- ↑ Armentrout, J., M., 1987, Integration of biostratigraphy and seismic stratigraphy: Pliocene–Pleistocene, Gulf of Mexico: Proceedings, Gulf Coast Section SEPM 8th Annual Research Conference, p. 6–14.
- ↑ 10.0 10.1 Galloway, W., E., 1989a, Genetic stratigraphic sequences in basin analysis I: architecture and genesis of flooding-surface bounded depositional units: AAPG Bulletin, vol. 73, p. 125–142.
- ↑ 11.0 11.1 Galloway, W., E., 1989b, Genetic stratigraphic sequences in basin analysis II: application to northwest Gulf of Mexico Cenozoic basin: AAPG Bulletin, vol. 73, p. 143–154.
- ↑ 12.0 12.1 Schaffer, B. L., 1987a, The potential of calcareous nannofossils for recognizing Plio-Pleistocene climactic cycles and sequence boundaries on the shelf: Proceedings, Gulf Section SEPM 8th Annual Research Conference, p. 142-145.
- ↑ 13.0 13.1 Schaffer, B. L., 1987b, The nature and significance of condensed sections in Gulf Coast late Neogene sequence stratigraphy: Gulf Coast Assoc. of Geological Societies Transactions, vol. 40, p. 186-195.
- ↑ 14.0 14.1 Pacht, J., A., Bowen, B., E., Bearn, J., H., Schaffer, B., L., 1990, Sequence stratigraphy of Plio–Pleistocene depositional facies in the offshore Louisiana south additions: Gulf Coast Assoc. of Geological Societies Transactions, vol. 40, p. 1–18.
External links[edit]
| find literature about Recognizing stacked depositional sequences from well data |