Taxes
| Development Geology Reference Manual | |

| |
| Series | Methods in Exploration |
|---|---|
| Part | Economics and risk asseement |
| Chapter | About taxes |
| Author | Robert S. Thompson |
| Link | Web page |
| Store | AAPG Store |
Oil and gas taxes are of two general types: wellhead or production taxes, which are paid when the oil and gas are produced regardless of the amount of profit (or loss), and income taxes, which are paid on the amount of profit (called taxable income) defined by the IRS. Wellhead taxes in most states average about 5 to 10% of the revenue, and the current corporate income tax rate varies from 15% to 39% (see Table 1). Wellhead taxes include excise, ad valorem, and severance taxes.
| Taxable Income | Rate (%) |
|---|---|
| Not over cost::50,000 USD | 15 |
| Over cost::50,000 USD, less than cost::75,000 USD | 25 |
| Over cost::75,000 USD, less than cost::100,000 USD | 34 |
| Over cost::100,000 USD, less than cost::335,000 USD | 39 |
| Over cost::335,000 USD | 34 |
In federal income taxation, the fundamental concept being applied is the tax free return of invested capital. Congress legislates the definition of profit and thus when the investor will receive the tax free return of his investment. Expenditures in which the tax payer receives immediate tax free return are called expensed, whereas expenditures in which the tax payer spreads the tax free return of his investment over several years are said to be capitalized. The timing of the tax deduction for the capitalized expenditures are determined by a set of rules for depreciation, depletion, and amortization.
Oil and gas taxation is one of the most difficult areas of taxation. We attempt here to provide only a foundation of knowledge by presenting basic oil and gas terminology as it applies to taxation and a detailed tax model.[1] [2]
Oil and gas taxation terminology[edit]
Several important terms are used in oil and gas taxation practices of which the reader should be aware.
Leasehold costs[edit]
Leasehold costs are expenditures associated with the acquisition of an economic interest in a natural resource that are deemed to benefit future tax periods. Accordingly, leasehold costs are capitalized, and the tax free return of that expenditure are recovered through the allowable depletion calculation. The depletion deduction was created by Congress to give a means of returning the invested capital to the investor tax free as the resource is depleted. There are two methods of calculating depletion: cost depletion and percentage depletion. (See “Determining owners of oil and gas interests" and "Methods of conveyance” for more information on lease ownership costs and revenue.)
Lease bonus[edit]
The payment made by the lessee to the lessor for the right to explore for oil and gas and develop the property is called a lease bonus. The lease bonus payment made by the lessee is capitalized by the lessee and recovered through the allowable depletion calculation. (See “Nature of the oil and gas lease” for more on leases.)
Geological and geophysical (G & G) costs[edit]
Geological and geophysical (G & G) costs are expenditures for geological studies and geophysical work such as seismic surveys. If the expenditures result in the acquisition and retention of a property, the expenditures are capitalized and the tax free return of the investment is determined from the allowable depletion calculation. If the G & G costs do not lead to the acquisition or retention of a property, then these costs can be expensed in the taxable year the property is relinquished.
Lease and well equipment[edit]
Lease and well equipment includes such items as the wellhead, flow lines, separators, and other equipment necessary to operate the property as well as the labor to install the equipment. Expenditures for tangible items such as these are capitalized, and the tax free return of the expenditure is recovered through depreciation calculations. Other examples of tangible items include surface and production casing, even though the casing is cemented in the well and has no apparent salvage value. Upon abandonment, any undepreciated amount would be written off. The depreciation rules are always changing. As a result of the 1986 Tax Reform Act, the depreciation system is called the Modified Accelerated Cost Recovery System (MARCS) (see Table 1).
Intangible drilling and development costs (IDCs)[edit]
Special tax treatment for expenditures classified as intangible drilling and development costs, or IDCs, is available to the tax payer. U.S. Treasury Regulation 1.612-4 states that “all expenditures made by an operator for wages, fuel, repairs, hauling,…, incident to and necessary for the drilling of wells and the preparation of the well for the production of oil and gas” are IDCs. A well is considered to be prepared for production when the wellhead is installed. Table 1 shows the current tax treatment of IDCs. Again, tangible items such as surface casing and production casing are classified as tangible expenditures, and the tax free return of the expenditure is recovered through depreciation.
Lease operating expenses[edit]
Lease operating expenses are expenditures incurred in the day-to-day activities of the production operations. Basically, costs incurred during the current tax period that were spent in an effort to generate revenues during the current tax period are treated as current period expenses. Direct labor, power costs, and maintenance costs are some examples.
Current tax treatment[edit]
The last significant overhaul of oil and gas taxation is the result of the 1986 Tax Reform Act. An analysis and comparison of the tax rules prior to and after the 1986 Tax Reform Act are presented by Thompson.[3] Table 1 summarizes the current tax treatment for the integrated producer (typically, the major oil companies) and the independent producer and royalty owner (IPRO). The tax definitions for an IPRO and an integrated producer are presented in Ernst and Young's[4] Oil and Gas Federal Income Taxation. As you can see from Table 1, the IPRO receives preferential tax treatment.
Calculating after-tax net cash flow[edit]
The recommended approach to calculate after-tax net cash flow (NCF) is to use Equation 1, which is

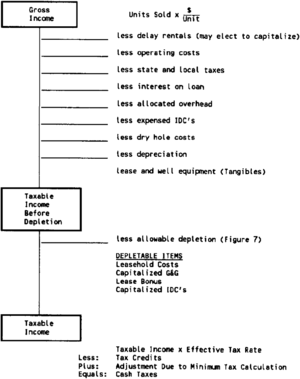
All transactions in the equation are cash items, one of which is cash income taxes. The separation of the tax calculation from the NCF calculation is recommended because of the many complications in oil and gas taxation. Instead of combining the NCF calculation and the tax calculation, the federal income tax model for oil and gas transactions (Figure 1) should be used to calculate the yearly taxes for the property, taking into consideration the appropriate tax treatment of each of the transactions. Once a cash tax liability (negative tax = tax savings) is calculated, this tax amount is subtracted, as shown in Equation 1.
It sounds simple and it actually is, once some experience is gained. Two worksheets are provided to help keep the numbers straight.[2] Tables 2 and 3 are the completed worksheets for the example development well in which the producer is an independent producer and royalty owner eligible for percentage depletion. Table 4 is the federal income tax calculations for the example multiwell extension project.
| Year | 1991 | 1992 | 1993 | 1994 | 1995 | 1996 | 1997 | 1998 |
|---|---|---|---|---|---|---|---|---|
| Gross Inc. (Gl) | 1576.075 | 864.968 | 474.705 | 260.523 | 142.978 | 78.468 | 43.064 | 2.752 |
| – Operating Costs | 24.000 | 24.000 | 24.000 | 24.000 | 24.000 | 24.000 | 24.000 | 2.158 |
| – Sev.Adv.Tax | 126.086 | 69.197 | 37.976 | 20.842 | 11.438 | 6.277 | 3.445 | 0.220 |
| – IDC Expense | 950.000 | 0.000 | 0.000 | 0.000 | 0.000 | 0.000 | 0.000 | 0.000 |
| – IDC Amortization | 0.000 | 0.000 | 0.000 | 0.000 | 0.000 | 0.000 | 0.000 | 0.000 |
| – Depreciation | 42.840 | 73.470 | 52.470 | 37.470 | 26.790 | 26.790 | 26.790 | 13.380 |
| Taxable Income Before Depletion | 433.149 | 698.301 | 360.258 | 178.212 | 80.750 | 21.401 | –11.171 | –13.007 |
| – Dept. Allowance | 236.411 | 129.745 | 71.206 | 39.079 | 21.447 | 11.770 | 0.000 | 0.000 |
| Taxable Income | 196.738 | 568.556 | 289.053 | 139.133 | 59.303 | 9.630 | –11.171 | –13.007 |
| Cash Tax Before Credits and Minimum Tax | 66.891 | 193.309 | 98.278 | 47.305 | 20.163 | 3.274 | –3.798 | –4.422 |
| – Tax Credit | ||||||||
| + Minimum Tax | ||||||||
| Final Cash Tax | 66.891 | 193.309 | 98.278 | 47.305 | 20.163 | 3.274 | –3.798 | –4.422 |
| Year | 1991 | 1992 | 1993 | 1994 | 1995 | 1996 | 1997 | 1998 |
|---|---|---|---|---|---|---|---|---|
| AMORTIZATION | ||||||||
| Capitalized IDCs, $M | 0.000 | |||||||
| Amortization rate | 0.20 | 0.20 | 0.20 | 0.20 | 0.20 | |||
| IDC Amortization, $M | 0.000 | 0.000 | 0.000 | 0.000 | 0.000 | |||
| DEPRECIATION | ||||||||
| Depr. basis (tangibles), $M | 300.000 | |||||||
| 7-year MACRS rates | 0.1428 | 0.2449 | 0.1749 | 0.1249 | 0.0893 | 0.0893 | 0.0893 | 0.044 |
| Depreciation Expense, $M | 42.840 | 73.470 | 52.470 | 37.470 | 26.790 | 26.790 | 26.790 | 13.380 |
| DEPLETION | ||||||||
| Depletion basis, $M | 125.000 | 0.000 | 0.000 | 0.000 | 0.000 | 0.000 | 0.000 | 0.000 |
| Cost depletion, $M | 57.211 | 0.000 | 0.000 | 0.000 | 0.000 | 0.000 | 0.000 | 0.000 |
| 15 % Gl | 236.411 | 129.745 | 71.206 | 39.079 | 21.447 | 11.770 | 6.460 | 0.413 |
| 100 % TIBD | 433.149 | 698.301 | 360.258 | 178.212 | 80.750 | 21.401 | –11.171 | –13.007 |
| Percentage depletion, $M | ||||||||
| Lessor of 15% Gl or 100% | ||||||||
| TIBD | 236.411 | 129.745 | 71.206 | 39.079 | 21.447 | 11.770 | –11.171 | –13.007 |
| Allowable Depletion, $M | ||||||||
| Greater Cost or % | 236.411 | 129.745 | 71.206 | 39.079 | 21.447 | 11.770 | 0.000 | 0.000 |
| Gross oil production (MBO) | 96.066 | 52.722 | 28.934 | 15.880 | 8.715 | 4.783 | 2.625 | 0.168 |
| Oil res. beg. of period | 209.892 | 113.826 | 61.104 | 32.170 | 16.290 | 7.575 | 2.793 | 0.168 |
| Year | Gross Income ($M) | Operat. Costs ($M) | SEV&ADV Tax ($M) | IDCs DHCs ($M) | DEPR | TIBD ($M) | Cost Depletion ($M) | Percent Depletion ($M) | Allowable Depletion ($M) | Taxable Income ($M) | Tax Credits ($M) | Cash Taxes ($M) |
|---|---|---|---|---|---|---|---|---|---|---|---|---|
| 1991 | 1576.075 | 24.000 | 126.086 | 3400.000 | 128.520 | –2102.531 | 37.187 | –2102.531 | 37.187 | –2139.718 | 0.000 | –727.504 |
| 1992 | 2441.043 | 48.000 | 195.283 | 950.000 | 263.250 | 984.510 | 77.608 | 366.156 | 366.156 | 618.353 | 0.000 | 210.240 |
| 1993 | 2915.748 | 72.000 | 233.260 | 950.000 | 273.720 | 1386.768 | 6.472 | 437.362 | 437.362 | 949.406 | 0.000 | 322.798 |
| 1994 | 3176.271 | 96.000 | 254.102 | 0.000 | 238.350 | 2587.820 | 0.000 | 476.441 | 476.441 | 2111.379 | 0.000 | 717.869 |
| 1995 | 1743.175 | 96.000 | 139.454 | 0.000 | 170.310 | 1337.411 | 0.000 | 261.476 | 261.476 | 1075.935 | 0.000 | 365.818 |
| 1996 | 956.675 | 96.000 | 76.534 | 0.000 | 144.630 | 639.511 | 0.000 | 143.501 | 143.501 | 496.009 | 0.000 | 168.643 |
| 1997 | 525.034 | 96.000 | 42.003 | 0.000 | 133.950 | 253.081 | 0.000 | 78.755 | 78.755 | 174.326 | 0.000 | 59.271 |
| 1998 | 267.262 | 74.158 | 21.381 | 0.000 | 93.720 | 78.003 | 0.000 | 40.089 | 40.089 | 37.914 | 0.000 | 12.891 |
| 1999 | 124.284 | 50.158 | 9.943 | 0.000 | 40.170 | 24.013 | 0.000 | 18.643 | 18.643 | 5.371 | 0.000 | 1.826 |
| 2000 | 45.816 | 26.158 | 3.665 | 0.000 | 13.380 | 2.613 | 0.000 | 2.613 | 2.613 | 0.000 | 0.000 | 0.000 |
| 2001 | 2.752 | 2.158 | 0.220 | 0000 | 0.000 | 0.374 | 0.000 | 0.374 | 0.374 | 0.000 | 0.000 | 0.000 |
| 5300.000 | 1500.000 | 1862.597 | 1131.851 |
The case for an integrated producer is an easier case since the producer can only take cost depletion.

Calculating allowable depletion[edit]
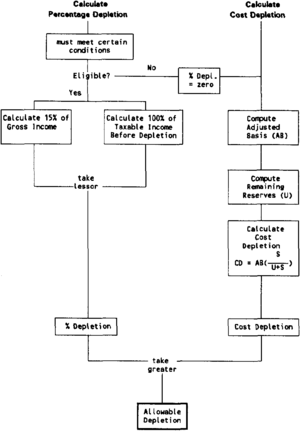
Determining the allowable depletion deduction is probably the most difficult calculation. Figure 2 is intended to help with this calculation. As shown in Figure 2, allowable depletion is the greater of cost depletion or percentage depletion. Cost depletion is calculated by taking the remaining depletable basis (unrecovered G & G costs and lease bonus) and multiplying by the fraction of the remaining reserves produced during the year (production during the year divided by reserves at the beginning of the year). All producers are eligible for cost depletion. Independent producers and royalty owners are also eligible for percentage depletion. Percentage depletion is the lesser of 15% of gross income or 100% of taxable income before depletion from the property. Prior to January 1, 1991, the Taxable Income limitation was 50% for each property. This change is the result of the Revenue Reconciliation Act of 1990. This recent change also demonstrates the “dynamics” of tax rules and the importance of seeking professional advice in this area. An example of another complication in the tax law is the 65% of taxable income limitation from all sources (not just limited to the producing property). The 65% taxable income limit from all sources is difficult to apply to single project economics and is ignored in the example problems presented.
References[edit]
- ↑ 1.0 1.1 1.2 Thompson, R. S., Wright, J. D., 1985, Oil property evaluation, 2nd ed.: Golden, CO, Thompson-Wright Associates, 212 p.
- ↑ 2.0 2.1 Thompson, R. S., Wright, J. D., 1992, Oil and gas property evaluation, 3rd ed.: Golden, CO, Thompson-Wright Associates, in prep.
- ↑ Thompson, R. S., 1987, Impact of the new tax law on internal cash flow generation: Dallas, TX, 1987 SPE Hydrocarbon and Economics Symposium, SPE Paper 16309, p. 161–172.
- ↑ ErnstYoung1990, Oil and gas federal income taxation, p. 158–163.
