Techniques for enhancing seismic facies analysis
| Exploring for Oil and Gas Traps | |

| |
| Series | Treatise in Petroleum Geology |
|---|---|
| Part | Predicting the occurrence of oil and gas traps |
| Chapter | Exploring for stratigraphic traps |
| Author | John C. Dolson, Mike S. Bahorich, Rick C. Tobin, Edward A. Beaumont, Louis J. Terlikoski, Michael L. Hendricks |
| Link | Web page |
| Store | AAPG Store |
Additional techniques for improving resolution and enhancing interpretations of seismic facies include the following:
- Seismic forward modeling
- Changing display scale for seismic data
- Changing display type for seismic data
- Using 3-D seismic displays
Seismic forward modeling[edit]
Forward modeling begins with a model in depth and coverts it to time. Put another way, forward modeling takes a 2-D or 3-D geological model and converts it to a simulated seismic section. The simulated seismic section can be compared to the actual seismic data. The geological model is adjusted until there is a match.
Forward modeling has three purposes:[1]
- Interpret stratigraphy and fluid composition at or near the limits of seismic resolution by waveform analysis.
- Simulate a geologic cross section seismically, showing stratal surfaces and impedance contrasts.
- Simulate reflection patterns seen in seismic sections by calculating stratal patterns from rates of subsidence, eustasy, and sediment supply.
Changing display scale[edit]
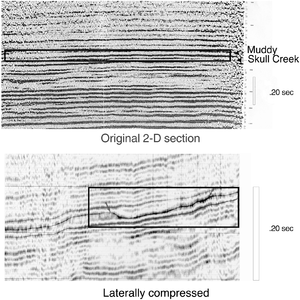
Choice of display scale can be critical in detecting subtle features in seismic data. Minute changes in dip are often difficult to detect on wiggle trace displays plotted at traditional scales. When such displays are horizontally compressed and vertically expanded, strati-graphic changes are magnified accordingly and become more visible. Unfortunately, structural changes are also magnified. This effect can be attenuated by flattening on an interpreted structural horizon.
Changing display type[edit]
Choice of display type can also be critical in detecting subtle features in seismic data. Two types that help in seismic facies analysis are horizontally compressed wiggle displays and color amplitude displays. Horizontally compressed wiggle displays also reduce the trace excursion or amplitude of the reflections, making important changes in reflectivity more difficult to discern. Color amplitude displays retain amplitude fidelity regardless of scale and are particularly useful when viewing horizontally compressed, flattened displays. These are often helpful in stratigraphic interpretation of subtle features.
3-D seismic displays[edit]
For stratigraphic interpretations, 3-D seismic data has a significant advantage over standard 2-D data because it images the subsurface at a much closer spacing, delineating very subtle changes in reflectors. The ability to map channels, fan lobes, pinch-outs, and other features is greatly enhanced. Amplitude, phase, and frequency can be mapped aerially in considerable detail, resulting in striking visual images of subsurface stratigraphic features. Horizon-based amplitude extractions are one of the most routinely used 3-D seismic display types. Changes in amplitude along a reflector may indicate changes in lithology, porosity, or fluid saturation. For additional details, see Brown.[2]
Example: compressing vertical scale[edit]
Older-vintage 2-D seismic data are often difficult to interpret for subtle stratigraphic changes. Figure 1, depicting the northern Powder River basin, Wyoming, shows the impact of compressing seismic sections on a workstation. A 6.4-km, 32-m-deep valley network incised in the Muddy Formation (Lower Cretaceous) is difficult to see on the original data display. However, by compressing the display, the incised valley fill becomes easier to recognize.
See also[edit]
- Seismic facies analysis
- Basics of seismic facies analysis
- Reflection configuration patterns
- Seismic facies mapping
- Analyzing individual reflectors
- Analyzing lithofacies
- Petrophysical analysis of lithofacies
References[edit]
- ↑ Vail, P., R., 1987, Seismic stratigraphy interpretation procedure, in Bally, A., W., ed., Atlas of Seismic Stratigraphy: AAPG Studies in Geology No. 27, p. 2.
- ↑ Brown, A., R., ed., 1999, Interpretation of Three-Dimensional Seismic data, Fifth Edition, AAPG Memoir 42, 514 p.
