Two-dimensional geophysical workstation interpretation: generic problems and solutions
| Development Geology Reference Manual | |

| |
| Series | Methods in Exploration |
|---|---|
| Part | Integrated computer methods |
| Chapter | Two-dimensional geophysical workstation interpretation: generic problems and solutions |
| Author | Joe D. Stevens, Carl A. Marrullier |
| Link | Web page |
| Store | AAPG Store |
This article describes generic problems and solutions in loading and interpreting two-dimensional seismic projects on interactive workstations. Two key assumptions about the workstation are made here: no hardware constraints exist for memory or storage and an efficient database manager exists for data manipulation. A database manager allows data from a variety of sources to be compiled and managed as one coherent set; its structure defines user friendliness (see A development geology workstation).
Any workstation interpretation project requires some data preparation. The intent of this discussion is not to walk a user through every necessary procedure but to describe why and how some of the basic problems might be solved. The details of preparation will vary according to hardware and software, project type, and the type of data available for a given project; however, methodology will remain similar. With a little forethought, many (though not all) potential problems can be anticipated and thus minimized in the loading process. Ultimately, it is the interpreters' responsibility to ensure that data in the project conforms to a format and standard that satisfies company requirements. The speed and interactive capabilities of today's workstations allow raw paper and digital data to be input and then transformed into a final interpretation. The goal is to produce paper media exhibits that convey ideas and concepts successfully to management.
Preparation of a project for interpretation on a workstation differs between two-dimensional (2-D) and three-dimensional (3-D) data sets. Three-dimensional data are generally more coherent because only a single high density data set is usually involved. Two-dimensional projects are rarely confined to one data set, are widely spaced, are randomly oriented[1], and offer many challenges to the capabilities of an interactive geoscience system[2]. Because of data variables such as vintage, datum, field parameters, processing, and so on, 2-D data require more careful preparation than 3-D data. This chapter focuses on the 2-D case.
In general, interpretation projects can be partitioned into two broad phases: the preparation phase and the execution phase. Preparation involves interaction with data processing and data loading. Execution deals with working screen displays (map and seismic window manipulation) as a technique during interpretation.
Preparation phase
For this discussion, the preparation phase deals with the three major considerations leading to interpretation: base map, seismic, and geological preparation. Each have several subdivisions, as follows:
- Base map preparation
- Projection system
- Project size
- Seismic data files
- Well data files
- Cultural information files
- Seismic preparation
- Datum reference plane
- Polarity and phase convention
- Trace amplitude scaling
- Trace balancing
- Storage format
- Geological preparation
- Well data, such as curves, tops, and lithology
- Modeling
- Velocity information
Base map preparation
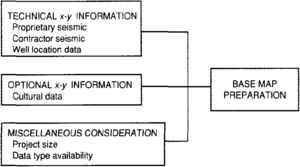
Technical data are surveyed and locations positioned most commonly by latitude and longitude. Coordinate projection schemes attempt to redefine latitude and longitude positions, as they would appear on a sphere, to some x–y reference system converted to a flat plane. The reason for this conversion is ease and speed of data manipulation and posting. Latitude and longitude data are in degrees, while x–y systems are in decimals[3]. A common projection system for positioning all project data (including proprietary seismic, contractor seismic, well, and cultural data) is critical for the relationship of multiple data sets and proper base map displays (Figure 1). Without a common projection system, one cannot reliably integrate multiple x–y data sets for display. Lacking this relationship, z information cannot be related properly for interpretation. Files containing technical base map information include seismic survey data, well location data, and reference annotation. The relationship files reside separately from the data files, allowing for seismic lines and well data to be posted on a base map. Technical data files that contain the z information, such as seismic traces and well deviation data, are linked to the x–y location files.
Initial project size and addition of data during interpretation is a prime factor to consider in the preparation phase of any 2-D project. With some software, project size is often awkward to modify. For example, detailing a prospect may demand more seismic data, and the additional profiles may not be available at project creation time. A 2-D project should be created of such a size that new data could easily be added when required (Figure 1).
Anticipating the availability of various seismic display types (such as stack, migration, inversion, or attribute) is facilitated by creating several data files, each containing a different process. This allows the user to select which data type to work with. Addition of seismic data files is simple and can be done at any time during a project.
Files with optional x–y information contain cultural or specialty information. Cultural information, that is, lease or topographic data, is considered map enhancement not critical to a project. Cultural information allows technical information and subsurface interpretations to be related to natural or man-made surface features. These files are at times used to highlight certain information to augment map displays. Examples of customized files might include man-made features (towns, roads, pipe lines, and leases), geomorphic data (waterways and topographic relief), highlighted wells (horizon penetrations, exploratory wells, and platform locations), or contour data ([gravity]], magnetics, and bathymetry).
Seismic preparation
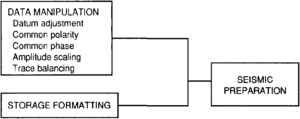
Displaying various vintages of data with the same datum, polarity, phase, and scaling is a convenience afforded by the workstation (Figure 2).
Correcting for datum shifts between vintages of seismic data is a tedious chore on paper. In the electronic environment, these shifts are assigned to each seismic line and the data adjusted at the time of display. After loading relative to the x–y location, data are adjusted to a common reference plane. Some data require a bulk time shift to tie other data sets. Bulk shifts are executed primarily in two ways: a correction time is added or subtracted to each profile and a correction velocity is applied to the profile. During interpretation, corrections dealing with a horizon are linked to that horizon, thus allowing for time variant adjustments. These conveniences allow the explorationist to concentrate on interpretation and decision making and not on data management[4].
Polarity is routinely adjusted to a common standard for a project at the time the data are loaded. Polarity and phase matching are done by cross-correlation. If, however, the data are not loaded with the same polarity convention, one can display lines in either or both polarities with ease. A common polarity convention among the data is useful when attributes, such as amplitude, are computed along an interpreted horizon.
Phase matching requires rotating the reflection data to match the wave shapes of the data. Phase matching of different data vintages is not normally done during the loading process. The responsibility for polarity and phase likeness falls on the interpreter. If the data for a project are currently being processed, these parameters can be attended to during processing by the processing geophysicists with guidance from the interpreter.
On the workstation, amplitude scaling and trace balancing are done at loading or can be performed interactively. The purpose of scaling data is to match the maximum amplitudes of the various data sets. Once the data are all in common character, interpretation and postprocessing enhancement are optimized. Multiple vintages of seismic data may require that each set be scaled separately. When mixed vintages of data are used, scaling must be to the same amplitude reference[5]. Fixed point data should be scaled so that the greatest amplitudes (positive or negative) are contained within the hardware display limits. In scaling the data, an attempt should be made to accommodate approximately 95% of the amplitudes. Here, a minimum of data is sacrificed (clipped) due to hardware display constraints. Statistical analysis of the data is performed to determine values that lie in the extremes. The data are then scaled to exclude only the extreme values. Preparing the data in this manner allows the geophysicist to begin interpretation as soon as a project is loaded.
Scaling can be done interactively and modified during interpretation. Interactive scaling is time consuming and frustrating if one is not well versed in the procedure. Scaling is most efficient when performed in the loading process.
The electronic environment provides the interpreter with a greater degree of detail than does paper. This detail is quantified by the size “word” written to tape and used for transfer of data. Typically, processed data are written as 16-or 32-bit words. This density of information translates to large volumes of information and requires a great deal of storage space. Retrieval and display time are slowed, even with the latest hardware. To minimize the display time and reduce storage space, data are reformatted during loading to an 8-bit word size for structural and stratigraphic interpretations. Once interpretation is complete, the 32-bit data can be loaded for detailed computations and attribute analysis.
Geological preparation
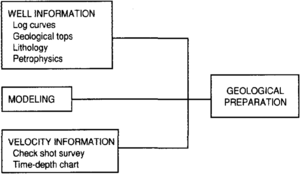
Well information is used in a variety of ways. The most basic is incorporation of geological tops into the seismic interpretation (Figure 3). These tops are input digitally or via keyboard entry. Once in the database, this information is easily manipulated and can be used for modeling.
Models generated from log data aid the seismic interpreter in relating seismic reflections to lithological information. Well tops associated with horizons on the seismic profiles fully integrate an exploration concept. Lithology types from the log model can be superimposed on the seismic traces for display or modification. By integrating a sonic log and density log (if available), one-dimensional seismograms that are created can help to identify seismic reflections representing geological interfaces. Log models can also be converted to 2-D synthetic seismic models by integrating velocity information and convolving the model with a seismic wavelet. Models can imitate seismic response to test geological concepts. Seismic resolution of geological features are determined, and simulated profiles are generated to tie wells.
Velocity information is important in relating geological data to seismic data. This information is derived by the interpreter from a variety of sources, the most common being check shot surveys obtained from wells, time-depth charts derived from stacked seismic data or seismic to well correlation, and velocity function curves. These data are input in digital form via digitizer pad or keyboard entry (Figure 3). When concatenated to a well, the wellbore, log curves, and geological tops can be displayed with the seismic. A three-dimensional velocity field can be created for conversion of time surfaces to depth maps.
With a time-depth relationship established, the synthetic seismograms are then adjusted to tie the seismic to the well control. Velocity data are used to adjust synthetic curves, seismic and well log models, depth converted horizons, and interval maps.
Executing A project
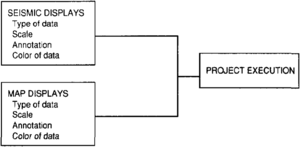
When executing a project, options dealing with display of the seismic data and maps should be considered. The workstation allows for a variety of display presentations that enhance structural or stratigraphic features and attributes of seismic data. Display options span the spectrum in importance. The four basic factors concerning the display of both seismic profiles and maps are (1) the type of display, (2) vertical and horizontal scales, (3) annotation, and (4) color schemes (Figure 4).
There are a variety of display types (variable density, variable area, and any of the wiggle or wiggle plus displays) available to the user of a workstation. Some enhance desired features or individual attributes, while others suppress unwanted ones. It is arguable which display type, combined with a scale and color scheme, showcases a feature best. That a variety of display types are available is the important factor.
The workstation has the capability of displaying seismic data with a wide range of vertical and horizontal preset scales. These window scales can be coupled with zoom or magnification options that provide the interpreter with countless scale combinations to view data. No longer is the interpreter confined to one or two fixed display scales or types because the data can be viewed in multiple ways. One can enlarge a limited time and shot point range within a window to focus on a particular feature of interest. Regional interpretation can optimally use decimated data. Similar effects are achieved in map view: a map can be enlarged to show each trace or reduced to show regional trends.
Also, seismic annotation is tailored to show as much or as little information as desired. Options include the following: (1) shot point, CMP, or trace numbers; (2) seismic line ties; (3) time annotation and/or timing lines; (4) line direction; (5) line name or internal identification; (6) data file used; (7) well type or identifiers; and (8) horizon and fault intersections. Map view annotation is also a feature that is customized to the situation. Options that can be modified on the base map are (1) line, shot point, CMP, or trace numbers; (2) wells and well tops; and (3) cultural data. Customizing options for an interpreted map are (1) sequence of appearance and color of display items; (2) ribbon or contour display of a horizon; and (3) fault contours, heaves, or polygons. A similar array of options are available for perspective views.
Use of color further increases the dynamic range visible in the seismic display. The value of color graphic displays is increasingly recognized. Admittedly, colors may be overused by novices; however, subtle features can be brought into focus with proper use of color schemes. Color schemes can be specifically tailored to complement selected attributes and display types.
Some interpreters are inclined to use one display (type, scale, annotation, and color) for structural work and another scheme for stratigraphic work. Other explorationists use one scheme for all their interpretation.
Concluding remarks
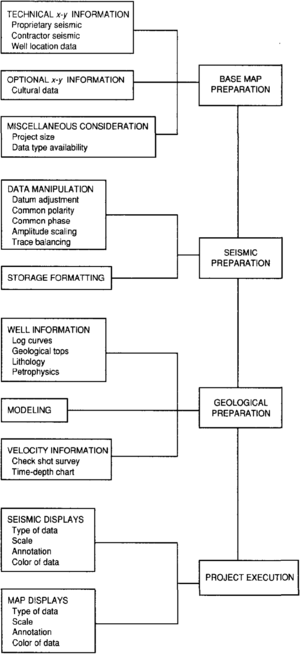
A flowchart summarizing the steps of project preparation and execution is shown in Figure 5. The topics touched on in this chapter could easily fill a volume. System software documentation should provide details describing “how-to” steps, but manuals generally do not address “when and why” situations. As most interpreters become familiar with a system, they learn how, when, and why a procedure is invoked and follow the same path for every project. The workstation is a toolbox of methods to speed and enhance the procedure. It is the interpreter's creativity, ingenuity, and imagination that generate meaningful interpretations. Explorationists use a number of techniques simultaneously to test and revise working hypotheses[4]. One is more inclined to test many ideas quickly since it will not so take long to try them[3]. A clever user can find paths that achieve results that were not deliberately programmed. An example might be as simple as using faults as horizon surfaces or vice versa for unique displays. These innovative uses, once proven, are occasionally programmed as menu items in new software releases.
Effective use of any workstation for interpretation is made easier by a good user interface. An interpretation can be achieved by the experienced user significantly faster on a workstation than on paper. Time saved by interactive interpretation allows more detailed analysis in the final product. It seems axiomatic that a significant majority of geoscientists place a high priority on ease of use. This user friendliness includes language or terms that are obvious in meaning, straightforward paths to achieve goals, and manipulations of the data that are meaningful. The hardware and software vendors have designed exemplary systems. Totally integrated interpretation systems are the stated goals of vendors that market such systems, although the industry has many improvements to make in achieving these goals.
See also
- Introduction to integrated computer methods
- Using and improving surface models built by computer
- A development geology workstation
- Log analysis applications
- Introduction to contouring geological data with a computer
References
- ↑ Valusek, J. E., Padgett, M., Austin, J., Page, I., 1990, Zoned autopicking of seismic boosts CAEX: Oil & Gas Journal, Feb. 26.
- ↑ Brown, J. A., 1990, Workstation issues—3-D and 2-D integration: Reflections, Southeastern Geophysical Society.
- ↑ 3.0 3.1 Coffeen, J. A., 1990, Seismic on screen—an introduction to interactive interpretation: Tulsa, OK, Pennwell Books.
- ↑ 4.0 4.1 Valusek, J. E., Chan, A. W., 1989, 2-D seismic workstations—tools or toys?: Asian Oil & Gas, Jan. 1989.
- ↑ Howell, G. S., Pepper, R. E. F., 1988, Mapping seismic amplitude and seismic attributes: Reflections, Southeastern Geophysical Society, April 1988.
