Appalachian Basin Marcellus gas play
| Shale Reservoirs: Giant Resources for the 21st Century | |
| |
| Series | Memoirs |
|---|---|
| Chapter | The Appalachian Basin Marcellus Gas Play: Its History of Development, Geologic Controls on Production, and Future Potential as a World-class Reservoir |
| Author | W. A. Zagorski, G. R. Wrightstone, and D. C. Bowman |
| Link | Web page |
| PDF file (requires access) | |
| Store | AAPG Store |
The Appalachian Basin has been an important shale-gas-producing province since the early 1800s, with an estimated 3.0 tcf already produced from Devonian black shale.[1] Until recently, the organic-rich Marcellus Shale, although recognized as a major source rock, was not a significant hydrocarbon producer in the Appalachian Basin. This has changed greatly in the last few years.
The modern era of Marcellus Shale production in the Appalachian Basin began in October 2004 when the Range Resources 1 Renz Unit well in Mount Pleasant Township of Washington County, Pennsylvania, was completed using a large Barnett Shale style slick-water frac treatment. This completion established the production rates needed to encourage both industry and public interest in the Marcellus Shale. As of September 2009, more than 70 companies have acquired lease positions and drilled numerous horizontal and vertical discovery wells, establishing a broad play area for the Marcellus Shale, encompassing more than 28 million acres across Pennsylvania, West Virginia, New York, Maryland, and Ohio. The play has attracted the attention of independents, major oil companies, and international partners, as discoveries continue to expand the scope of the play and shed light on the formation's reservoir characteristics and economic potential. Production from the Marcellus Shale is expected to exceed 1 billion cubic feet (gas equivalents) per day (bcfepd) in 2010.
The potential limits of the Marcellus Shale play can be defined to the north, south, and east by the outcrop belt of the unit and to the west by thinning of the Marcellus Shale or its removal by a Middle Devonian unconformity surface. Significant geologic parameters controlling the productive capability of the Marcellus Shale include thickness, total organic content, porosity, permeability, thermal maturity, pore pressure, depth, gas show characteristics, rock mechanics, natural fracturing, and structural complexity. A key component of the play is the large area where the Marcellus Shale has an overpressured profile, extending from northern West Virginia into most of southwestern and central Pennsylvania and into New York's southern tier.[2][3]
Reserve potential estimates for the Marcellus Shale have been recently significantly upgraded from 2.1 tcf of technically recoverable based on historic production.[4] to as much as 867 tcf based on a power-law distribution P10 case.[5] The wide area of prospective acreage, favorable geologic setting, and early production flow-test rates all suggest that the Marcellus Shale play contains enormous reserve potential, establishing the Marcellus Shale play as one of the major hydrocarbon accumulations in the world.
Previous research[edit]
During the 1970s, the U.S. Department of Energy initiated the Eastern Gas Shales Project (EGSP) to study the geology and production potential of the multiple organic-rich shales located in the northeastern United States. A total of 595 separate reports, articles, and reviews were generated by researchers working under the EGSP, leading to a voluminous available database on all the eastern shales, including the Marcellus Shale. In the Appalachian Basin, this enormous research effort was mostly directed toward the study of the controls on production within the Big Sandy field and to identify new major areas of Devonian shale-gas potential. These studies led the way to a significant expansion of the Big Sandy field into southwestern and central West Virginia and parts of southeastern Ohio. A large segment of the EGSP can be accessed from the National Energy Technology Laboratory.[6]
History of the Appalachian basin shale-gas development[edit]

The Appalachian Basin has a well-established history of shale-gas development (Figure 1). The discovery and commercial use of gas from Devonian shales in the early 1820s in Fredonia, New York, is generally recognized as the birthplace of the natural gas industry. This significantly predates the Drake oil discovery in Titusville, Pennsylvania, in 1859. By 1860, a series of shallow shale-gas fields were developed in a fairway along the Lake Erie shoreline extending from Fredonia, New York, southwest toward the city of Sandusky, Ohio.[7] Accurate data for these wells are scarce, but the likely black shale formations produced include the Dunkirk, Rhinestreet, Middlesex, and to a lesser extent the Marcellus. The initial reported gas rates were commonly high, but actual production rates and pressures were low and are not considered commercial by today's standards. These shallow wells were used mainly for domestic and light industrial purposes and were extensively developed from the 1860s through the mid-1900s.
The first major shale discovery in the Appalachian Basin was in 1921 in northeastern Kentucky, which established the Big Sandy field. To date, a total of more than 21,000 wells have been drilled in the Big Sandy field in eastern Kentucky, southern West Virginia, southern Ohio, and southwestern Virginia. The primary target in the Big Sandy field is the Upper Devonian Huron Shale, with contributions from the Cleveland, Rhinestreet, and Marcellus Shale intervals. Two characteristics of the Big Sandy field are its significant underpressured profile and a well-established open natural fracture network. This distinguishes the Big Sandy field from modern shale plays such as the Barnett, Fayetteville, and Haynesville shales, which have higher pressure gradients combined with lower density open natural fracture networks. These modern shale-gas plays rely more on the creation of induced artificial fractures to achieve commercial production rates than production from existing open natural fractures. To date, more than 2.5 tcf has been produced from the Big Sandy field,[1] and it still represents one of the top 100 gas fields in the United States. The development of the Big Sandy field continues using both vertical and horizontal drilling.[8]
Development of the Marcellus Shale Play[edit]
Unlike the Huron and Rhinestreet Shale members in the Big Sandy field, the Marcellus Shale, before 2007, was only a minor exploration target. Researchers involved in the EGSP identified the Marcellus Shale as a potential exploration target in the central and northern Appalachian Basin in the late 1970s. Identification of the Marcellus Shale as a potential target encouraged operators to pursue development of the resource, and in the late 1970s and early 1980s, several unsuccessful attempts to establish commercial production from the Marcellus Shale were performed. This initial testing failed to reach commercial play expectations because of technologic limitations and a lack of understanding of how hydraulic fracturing technology could be effectively applied in areas where natural fracture networks were lacking.
Industry interest for the Marcellus Shale can be tracked historically in the following phases:
- Early interest during the drilling of early gas discoveries in the underlying Huntersville Chert and Oriskany Sandstone (1930s through 1960s).
- Interest as a deeper secondary zone in wells drilled in the southern West Virginia part of the Big Sandy field. Currently, more than 1100 wells have been completed as Marcellus producers as a deeper zone in this area. The gas is typically commingled with that from shallower reservoirs.
- The Marcellus Shale became an important unconventional exploration target in the late 1970s and early 1980s following studies by the EGSP and was moderately tested in Pennsylvania and New York but yielded no significant field discoveries.
- The current period of industry interest and development initiated by the early vertical well discoveries from 2004 to 2006 was followed by a series of rapid field discoveries and the widespread application of horizontal drilling and completion techniques occurring from 2007 through the present day. The broad scope of the play and the discoveries achieved to date as well as recent economic studies of the play in Pennsylvania and West Virginia suggest that the Marcellus Shale will remain an important exploration objective during the next few decades or longer.
Early Huntersville Chert and Oriskany Sandstone wells commonly reported significant natural gas shows in the Marcellus Shale. These observed shows were commonly large enough to force cable drilling tools up the wellbore. Based on a review of these older wells, it is surprising that interest in this play failed to occur sooner as the shows were consistent, repeatable, and present over a large geographic area. The most significant characteristic of these shows is that although they had a high reported volume, they blew down very quickly, indicating limited wellbore connectivity to porosity, permeability, and natural fracturing. A few early Marcellus completions in northern and northeastern Pennsylvania were attempted either through natural completions or by explosive shot. Results of these tests were marginal, and the superior productive potential of the underlying Oriskany Sandstone target led to the bypassing of the Marcellus Shale for more than 70 yr.
As a result of the EGSP studies, several tests of the Marcellus Shale were completed in south-central New York and southwestern Pennsylvania from 1979 through 1982. The Marcellus Shale tests drilled in 1982 in Washington County, Pennsylvania, are located adjacent to the Range Resources initial Renz discovery well and core development area for the Marcellus Shale. In Allegheny and Washington counties of Pennsylvania, two of the four attempted tests of the Marcellus were completed with carbon dioxide or nitrogen foam treatments and showed the poorest results of these early tests. The most successful early tests in Washington and Allegheny County, Pennsylvania, were completed with slick-water gel fracs. Although these early water fracs were more effective than the foam treatments, these treatments were simply not large enough to establish the rates of production needed to achieve play commerciality on a broad scale.
The New York State Energy and Research Development Authority (NYSERDA) helped fund several tests of the Marcellus Shale located in south-central New York in the late 1970s. These wells were extensively studied and achieved marginal rates of production but were insufficient for large-scale development. These NYSERDA-funded Marcellus Shale tests were all completed using foam-based fracture treatments.[9]
Additional experimental tests of the Marcellus Shale were conducted by Belden and Blake in 1997 in Bradford County, Pennsylvania, in Stagecoach field, which produces from the Oriskany Sandstone. These wells were also completed using a carbon dioxide treatment that also failed to establish commercial production rates.
The modern era of Marcellus Shale gas development began in late 2004 with the completion of the Range Resources Corporation 1 Renz Unit well test located in Washington County, Pennsylvania. The well originally was planned as a structural test of the Westland Dome, a structural closure associated with a left-lateral strike-slip fault system. The 1 Renz Unit well was drilled in 2003, targeting the Lower Devonian Huntersville Chert and Oriskany Sandstone along with the deeper Silurian Lockport Dolomite. Although several significant shows were encountered in the Lockport interval, attempts to complete this zone failed. During drilling, several large gas shows were observed and recorded in the Marcellus Shale, and a subsequent study indicated favorable comparisons of the Marcellus Shale to the Barnett and Fayetteville shales. On October 23, 2004, a large Barnett-style water frac consisting of 3,569,500 L (943,000 gal) of water and 167,800 kg (370,000 lb) of sand was used to treat a 27 m (90 ft) gross interval of the Marcellus organic shale in the Range Resources 1 Renz Unit. A flow test of approximately 0.400 mmcfepd and an overpressured gradient was observed. This prompted two further offsets by the operator in 2005 that achieved similar encouraging results.
Play activity started to slowly accelerate in 2006 within the high-pore-pressure area of the play with the drilling of 28 Marcellus wells located along a wide fairway stretching from north-central West Virginia, through most of Pennsylvania and into southern New York. Several companies completed Marcellus wells, including discoveries by Range Resources Corporation, Cabot Oil and Gas, Dominion Energy, Fortuna/Talisman, M amp M Energy, Atlas Energy, and Pennsylvania General Energy. A key vertical Marcellus discovery well was drilled in 2006 by Cabot Oil and Gas that brought the northeastern part of Pennsylvania to its modern era of shale-gas development. The discovery well, the Cabot Oil and Gas 5 Teel, was the first new oil and gas well drilled in Susquehanna County in 34 yr and was the fifth well ever drilled in that county. It reported a maximum production test rate to atmosphere of 7 mmcfpd.[10] The first operationally successful horizontal test of the Marcellus Shale was drilled in 2006 by Range Resources Corporation in Washington County, Pennsylvania.
The drilling levels increased significantly in 2007, with 153 wells completed during that year. Atlas Energy began its successful development of the Marcellus Shale in southwestern Pennsylvania. In 2007, the first significant horizontal completion was reported in Washington County, Pennsylvania, by Range Resources Corporation, with a reported initial potential (IP) of 3.9 mmcfepd. Also in 2007, Cabot Oil and Gas drilled its confirmation well, offsetting the 2006 discovery of the 5 Teel well in Susquehanna County. Several other key step-out and exploration wells were drilled in Butler, Elk, Greene, Clarion, and Lycoming counties of Pennsylvania. Significant drilling programs were initiated by Atlas Resources, Chief Oil and Gas, EOG Resources, Eastern American Energy, Pennsylvania General Energy, Range Resources Corporation, Rex Energy, Texas Keystone, and others. During 2007, the focus was still clearly on vertical well testing, and only a limited number of horizontal wells were drilled and completed.
The year 2008 was the breakout year for the Marcellus Shale play, with more than 360 completed wells reported for that year. Several key vertical and horizontal discoveries were established. These include discoveries reported by CNX Gas and EQT in Greene County, Pennsylvania, and Epsilon Resources in Susquehanna County, Pennsylvania. Encouraging vertical test results were reported by Atlas Energy in Fayette and Westmoreland counties of Pennsylvania after developing effective two-stage fracturing techniques for vertical wells, with average test rates after completion of 2 mmcfpd. Range Resources reported several strong horizontal wells with reported IPs ranging from 4 mmcfepd to more than 26.0 mmcfepd in Washington County, Pennsylvania.[11]
Current drilling for the Marcellus has been focused along a northeast–southwest-trending fairway extending more than 800 km (500 mi) in length and mainly targeting areas where the Marcellus Shale occurs at vertical depths of 1370 m (4500 ft) or greater. As of July 2010, more than 100 drilling rigs and 31 operators were reported active in the Marcellus Shale play across 26 separate counties in Pennsylvania and West Virginia. By midyear 2010, at least 800 Marcellus wells had been completed in the overpressured area of the play by 70 companies. New discoveries were reported in 2009 and 2010 by Chesapeake, Ultra Petroleum, East Resources, and Talisman Energy across broad areas of the play, including large discoveries in Bradford and Tioga counties, Pennsylvania. Cabot Oil and Gas reported some of the highest reported IP rates for its horizontal wells (6.0–18.0 mmcfpd) as it significantly expanded its Susquehanna County project area. Finally, in early 2010, the first reported successful horizontal tests of the Upper Devonian Genesee Group and Ordovician Utica Shale were reported by Range Resources, opening new opportunities to further expand shale-gas development in the Appalachian Basin.
Stratigraphic framework[edit]

Figure 2 shows the regional stratigraphy of the Devonian shales and the Marcellus Shale Formation. The Middle Devonian Marcellus Shale Formation is located within the lower part of the Hamilton Group, which is bounded above by the Middle Devonian Tully Limestone and below by the Lower Devonian Onondaga Limestone (Onesquethaw Group). The Marcellus is divided into two members, the lower Marcellus/Union Springs Shale and the upper Marcellus/Oatka Creek Shale, which are separated by the Cherry Valley/Purcell Limestone. Lash[15] interprets the Cherry Valley and the Purcell limestones to be equivalent, although other authors, including de Witt et al.[16] and Werne et al.,[17] show the Cherry Valley and Purcell as separate members.
Several unconformities have been identified within the Marcellus Shale by Lash[15] in distal areas of the Appalachian Basin in western New York and northwestern Pennsylvania. These include unconformities that are the upper sequence boundaries for Union Springs and Oatka Creek shales. Lash[18][19] documents that the entire Union Spring Shale is removed by a regional disconformity in some of these areas. These unconformity surfaces below and above the Marcellus Shale are interpreted to become conformable to the southeast, into the deeper parts of the basin.[20][21][22] A major Middle Devonian unconformity above the Tully Limestone[20] progressively removes stratigraphically older units from east to west. Moving west toward the Cincinnati arch, this unconformity truncates the entire Tully, Hamilton, and progressively older formations.
Regional depositional setting[edit]

Ettensohn[24][25][26][27] assigned the period of deposition of the Marcellus Shale to the second of four tectonically related depositional phases associated with the Devonian Acadian orogeny. Each of Ettensohn's four tectophases of the Acadian orogeny represent regressive episodes that were further subdivided into four stages: (1) the beginning of tectonism and rapid subsidence leading to the accumulation of black shales; (2) deposition of gray shales and siltstones because of impending collision and regression; (3) collision causing widespread uplift and regional disconformities; and (4) widespread accumulation of limestone during a tectonically quiet transgressive period.
The Acadian orogeny was the result of a probable collision between a part of the North American plate and a microcontinent called the Avalonian terrain.[28] Ettensohn[24][25] linked basin deformation and subsidence to fold-belt orogeny, where a migrating foreland basin (i.e., proximal trough) was created cratonward (westward) of the orogen with a forebulge, the Cincinnati arch, located even farther cratonward to the west. This model suggests that major orogenic highlands (Acadian Highlands) were located to the east of the Marcellus depositional basin from which clastic sediments were derived. These highlands also contributed to deformational loading, providing the accommodation space for accumulating sediments within the subsiding basin.
During deposition of the Marcellus Shale, the central Appalachian Basin is interpreted to have been located between 15 and 30degS latitude[26] with an associated dry tropical or savanna-like climate where rainfall was seasonal with extended dry conditions. In addition, the area was likely to have been subjected to significant seasonal storm activity.[29] Reconstructions place the basin in the path of southeasterly trade winds, which would have carried moisture from the Iapetus Ocean westward across the Acadian Highlands located east of the basin.[25] Ettensohn[25] proposed that the Acadian Highlands created a rain shadow effect on the western slopes of these highlands that would have contributed to the arid conditions. The arid conditions and prevailing trade winds are likely to have introduced eolian siliciclastics into the Marcellus depositional basin from lands to the east. Werne et al.[17] reported the presence and enrichment of eolian silt grains in the organic-rich facies of the Oatka Creek and directly related this to a decrease in carbonate and noneolian siliciclastic sediments. In addition, Sageman et al.[30] reported a direct relationship between increasing eolian silts and increasing total organic carbon in the Marcellus Shale.
Based on petrographic analysis of preserved organic matter from the Marcellus in western New York, Sageman et al.[30] reported that the Marcellus black mudstone contained 100% marine material. The organic-rich facies of the Marcellus are dominated by short alkanes, whereas the reverse is true for the non-organic-rich facies that are dominated by long alkanes.[31] This indicates that terrestrial input of organic material into the basin was dominant during those periods when non-organic-rich muds and carbonate were deposited and that algal marine phytoplankton were dominant during the deposition of the Marcellus organic-rich black mudstones.
Like other organic-rich shales, the creation, deposition, and preservation of the organic Marcellus sediments was controlled by three factors: (1) primary photosynthetic production, (2) bacterial decomposition, and (3) bulk sedimentation rate.[30] The traditional interpretation of deposition of the organic-rich members of the Marcellus Shale is a preservation model of organic enrichment, where a permanently stratified water column with anoxic or euxinic (anoxic-sulfidic) bottom water conditions allowed for the preservation of organic material.[32] This preservation model is best reflected in the proposed model of a nearly permanent pycnocline by Ettensohn.[26]
Recent workers have disputed the original theory of deep-water deposition with consistent anoxia. Werne et al.[17] and Sageman et al.[30] proposed that deposition of the Marcellus organic-rich members did not appear to have been beneath a permanently stratified water column. Instead, they proposed that the Marcellus organic-rich units were deposited without a permanent pycnocline and with possible seasonal fluctuations. Macquaker et al.[33] investigated the Marcellus Shale at bed-scale levels and found a variety of sedimentary structures inconsistent with a continuous deep-water anoxic model, including rip-up clasts and ripple lamina. Based on this work, Macquaker et al.[33] proposed that the organic-rich mudstones were not deposited in waters that were persistently anoxic, but that instead, the sea floor was occasionally reworked, which would have led to a destruction of a part of the organics. Boyce and Carr[34] proposed that possible small local microanoxic environments were factors in the deposition of the organic-rich members based on local variations in the black shale units and thin limestones.
The paleogeographic reconstruction by Ettensohn,[25] Woodrow and Sevon,[35] and Blakey[23] shows that the organic-rich deposition occurred in a large, nearly enclosed, three-sided embayment that likely would have served to enhance oceanic organic productivity. Figure 3 shows the paleogeographic reconstruction by Blakey[23] of the Appalachian area about 385 Ma. The arid conditions that were likely present during deposition of the organic-rich facies led to a probable sediment starvation, as evidenced by the decrease in noneolian siliciclastic deposition in the organic-rich facies, preventing dilution of the accumulating organic material.
Wrightstone[36] proposed that the Marcellus organic-rich units were deposited and accumulated in a perfect storm scenario of maximum organic production, noneolian sediment starvation, and maximum preservation. He proposed that algal blooms associated with periodic dust storms led to enhanced production of organics and possible basinwide anoxic events.
Regional Structure[edit]

The major structural features of the Appalachian Basin, key shale production trends, and structural provinces of the Appalachian Basin are depicted in Figure 4. Key structural elements of the Appalachian Basin from west to east include the Waverly arch and Cincinnati arch to the west, the Cambridge arch and Burning Springs anticline farther eastward, the Rome trough, and the anticlinal fold belts in the Appalachian Plateau and Valley and Ridge province. To date, most economic productive Marcellus wells are located within the Appalachian Plateau physiographic province. This province is marked by generally gentle structures and a lack of intense faulting in the western parts of the province. Structural complexity increases to the east toward the structural front, where high-amplitude, detached, salt-cored anticlines are present trending northeast–southwest. Structural complexity may also occur in the synclines within the eastern parts of this province. The structural front represents the boundary between the plateau and the Valley and Ridge province, where the Devonian section rises quickly to the surface and crops out. The Valley and Ridge province represents the most structurally challenging area in which the Marcellus Shale is present. The area is structurally complex, with high-amplitude detached folds, repeated and overturned beds, and multiple thrust faults.
Controls Caused by Basement Faulting[edit]

A key regional component of the emerging Marcellus Shale play is its relationship to basement faulting. Figure 5 depicts the basement structure of the Appalachian Basin, together with major interpreted faults, the projected position of the Rome trough, and key Devonian shale and Marcellus Shale production trends. The mapped basement faults fall into two classifications: (1) those faults that are strike parallel to the basin and related to the Rome trough and (2) those faults that trend perpendicular to the strike of the basin and are interpreted as transform faults or cross-strike structural discontinuities (CSDs).[41] These basement faults represent zones of weakness believed to have been reactivated several times during the Paleozoic.[42][43][44] In addition, reactivation caused significant structural inversion in some areas. It is likely that movement along these faults has continued well into the Quaternary, as the surface expression of several of these major features are clearly apparent on both topographic maps and satellite images.
The Rome trough is a prominent structural feature of the Appalachian Basin, representing a failed rift system formed in the Middle Cambrian. The Rome trough has been extensively studied in West Virginia and eastern Kentucky, and it extends into Pennsylvania and New York.[41][37][45][46] Shumaker[44] showed several areas where the Rome trough affected sedimentation of key Devonian organic shale members and also where reactivation of basement faults provided for enhanced areas of natural fracturing in the Cottageville and Midway Extra Shale fields in West Virginia. These basement faults are well documented to have been active during the Late Devonian, affecting deposition of reservoir sands along Rome trough-bounding faults in West Virginia and Pennsylvania.[47][41][48][49] Closer to the emerging Marcellus Shale play, Kulander and Ryder[46] defined the boundaries of the Rome trough in southwestern Pennsylvania through a series of regional cross sections and regional seismic profiles. The Rome trough appears to delineate areas of maximum deposition of key organic shale beds in the Marcellus Shale as well as overlying beds such as the Tully Limestone. In addition, it is a critical feature related to both the burial and thermal maturity history of the Marcellus Shale.
Offsetting the Rome trough strike-parallel basement faults are a series of cross-striking basement faults, which are likely transform faults created during rifting episodes in the Cambrian and Ordovician.[41] These faults experienced several subsequent episodes of reactivation. The faults have been identified based on lineament studies, remote-sensing analysis, surface drainage patterns, and structural mapping. The surface expressions of these strike-normal faults were termed cross-strike structural discontinuities by Wheeler.[50] The two most significant are the Tyrone-Mt. Union lineament[51][52] and the Pittsburgh-Washington lineament.[53] Rodgers and Anderson[52] reported that an increase in natural fracturing and also enhanced hydrocarbon and fluid migration occurred along the Tyrone-Mt. Union lineament.
Within the Appalachian Basin, these features have a significant and typically detrimental effect on oil and gas production from many reservoirs, including the Lower Devonian Oriskany/Chert, Upper Devonian sands, Silurian Medina reservoirs, and the Ordovician Rose Run Sandstone reservoirs, with field terminations occurring at or near the cross-strike features. The effects that CSDs may have on Marcellus Shale production is not fully known at this time. However, it should be noted that one of the major Marcellus development projects to date is the Range Resource Washington County project, which straddles the Pittsburgh-Washington lineament.
Geologic controls on Marcellus shale production[edit]
The key elements controlling production from the Marcellus Shale are considered to be as follows:
- Thermal maturity
- Total organic carbon (TOC) content
- Depth
- Pressure gradient
- Thickness
- Porosity and permeability
- Gas in place
- Basement faulting and structural complexity
- Degree of natural fracturing
- Lateral landing target and orientation
- Ability to hydrofracture
Several of these parameters as they relate to the Marcellus Shale are addressed in this chapter. Other important issues such as lateral landing points, rock mechanics, and borehole stability are not readily available in the public domain and are mostly considered proprietary.
Thermal Maturity Patterns for the Marcellus Shale[edit]

Figure 6 is the thermal maturity map of the Marcellus Shale using public and proprietary measured vitrinite and calculated vitrinite reflectance (Ro) data. Thermal maturity patterns in the Marcellus Shale generally increase in a southeasterly direction, ranging from 0.5% Ro in northwestern Pennsylvania and eastern Ohio to greater than 3.5% Ro in northeastern Pennsylvania and southeastern New York. Recent Marcellus Shale drilling activity and results indicate that the most significant hydrocarbon potential and production occurs approximately southeastward of the 1.0% Ro maturity contour in the western parts of Pennsylvania, West Virginia, eastern Ohio, and southern New York. At thermal maturity values of greater than 3.5% Ro, the potential from the Marcellus Shale may become problematic based on the limited drilling results released to date. Also shown on Figure 6 are major basement fault patterns and the Rome trough. Several major cross-striking basement faults appear to relate to discontinuities in the observed thermal maturity patterns. In addition to the observed influence of basement fault patterns, the Marcellus Shale play in northeastern Pennsylvania appears to have been subjected to greater depths of burial as well as increased sedimentation and subsidence rates,[55] which also may have influenced thermal maturity patterns.
Thermal maturity is a critical play element for the Marcellus Shale. Thermal maturity studies for the Appalachian Basin[56][54][57][58][59] assume that the measured Ro values in the Marcellus Shale require greater depths of burial and higher temperatures than observed at the present day. The Rome trough and associated basement faults were critical to reaching the needed burial depths and pressures. The northwestern boundary of the Rome trough likely represents a hinge zone where rapid burial of the Marcellus Shale allowed it to reach the current observed thermal maturity levels.
The two emerging core areas developing in the Marcellus Shale play have somewhat different thermal maturity characteristics. In the southwestern area, the established production to date from the Marcellus occurs in a vitrinite reflectance range of 1.0 to 2.8% Ro, with commercial gas discoveries occurring both in a dry gas window to the east as well as a combination gas-gas condensate play to the west. Here, British thermal unit (Btu) contents in the Marcellus Shale range from approximately 1000 to the east and approach 1400 in the western areas near the 1.0% Ro contour. The established productive areas of the Marcellus in the northeastern part of the play have a higher thermal maturity profile, with the most production occurring between Ro values of 2.0% to more than 3.0%. Here, the Btu values are in the range of 1000 to 1080 Btu.
Total Organic Carbon Content[edit]
Present-day TOC content in the Marcellus Shale ranges from less than 1% to more than 15% (wt. %), establishing the Marcellus Shale as a world-class source rock. Analysis of data from proprietary whole core and sidewall programs from 15 wells drilled by Range Resources in Pennsylvania indicates that TOC values in the Marcellus Shale range from less than 1% to more than 15%. Recent work in the Marcellus Shale play in New York[60] indicates that TOC values in the Marcellus Shale average 6.5% and range from less than 1% to 11%. The EGSP studies analyzed TOC contents for the various Devonian shales, identifying a range from 1 to 27% from all Devonian shales in the EGSP study.[61] However, most of these data are only readily available as interval averages. These earlier studies did indicate that the Marcellus Shale, in general, had higher TOC contents in the thermogenic areas of the Appalachian Basin as compared with the other organic-rich Devonian shales. Minimum threshold values for good source rocks and prospective shale-gas plays are typically 2.0% TOC or higher.[62] As such, the Marcellus Shale has some of the highest TOC contents of thermogenic-style shale plays. Studies by Reed and Dunbar[63] suggest calculated original TOC contents in the Marcellus Shale to be in the 4 to 20% range.
One of the best indirect measurements of TOC content in the Marcellus Shale is its gamma-ray count. Schmoker[64][65] documented a direct correlation between the organic content of Appalachian shales and the wireline log gamma-ray intensity. Significant TOC content (5%) can be identified with gamma-ray counts of 200 API units or greater. In some areas, particularly in southwestern Pennsylvania and northern West Virginia, peak gamma-ray counts in excess of 300 to 400 API are not uncommon and reflect the generally higher TOC contents in the southwestern Marcellus Shale play area when compared with the northeastern parts of the play. Within the Marcellus Shale play, TOC content can be directly related to porosity development resulting from the conversion of kerogen to hydrocarbons.
Drilling Depth to Base of Marcellus[edit]

Figure 7 is a map of the drilling depth to the base of the Marcellus Shale and illustrates the structural framework of the Appalachian Basin as one of a strongly asymmetric trough. The depth to the base of the Marcellus Shale increases gently to the southeast to more than 2752 m (gt8500 ft). The maximum drilling depths are encountered in synclines just basinward of the structural front. Most of the permitted and drilled Marcellus wells are located in areas where the drilling depth is in the 1375 to 2750 m (4500 to 9000 ft) range. In general, increased depth will result in higher gas-in-place (GIP) values because of the increase in pressure within an overpressured environment, thus providing the current bias toward drilling below 1200 m (4000 ft). To date, most drilling has been at depths of 1375 m (4500 ft) or deeper, although a review of historic drilling data indicates that the Marcellus Shale had significant natural shows at depths shallower than 1375 m (4500 ft). An analog for these shallower areas of the Marcellus Shale play is the Fayetteville Shale where large areas of commercial development exist between depths of 610 to 1980 m (2000–6500 ft).
Pressure Gradient for Marcellus Shale Play[edit]
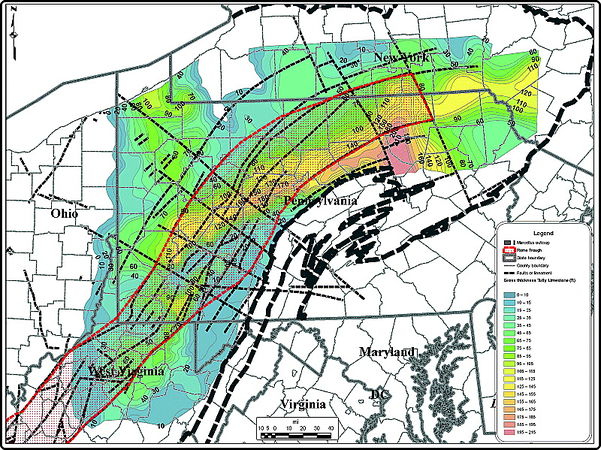
Figure 9 A map showing the gross thickness of the Tully Limestone, the Rome trough, and key basement faults.


A key parameter affecting the Marcellus Shale play is the pressure gradient. Pressure gradient is defined as the quotient of the bottom-hole pressure (psi) divided by the depth to reservoir. The Marcellus Shale productivity is impacted both positively and negatively by variations in the pressure gradient. A near-normal or overpressured gradient is essential for the effective application of large-scale water fracs such as those applied in the original Barnett Shale play and its expansions.
Accurate pressure gradient maps for the Marcellus Shale are unavailable at the present time because of the lack of reported pressure test data from productive Marcellus wells. Recent corporate press releases and limited completion data suggest industry estimates of 0.40 to more than 0.80 psi/ft. It is proposed that historic pore-pressure data from the underlying Oriskany Sandstone and Huntersville Chert producing wells can be used to infer pressure data trends for the Marcellus Shale. It is proposed that the Marcellus, Oriskany, and Huntersville are all part of a single pressure system, as it has been well documented that open natural fractures and faults that contribute to the production performance in the underlying reservoirs extend upward into the Marcellus Shale. Using maximum reported surface pressure data from selected well records from early Huntersville Chert-Oriskany Sandstone wells, a qualitative estimate of the changes in the Marcellus Shale pressure regime can be mapped.
The locations of these identified pressure regimes are shown on Figure 8. As shown, three pressure regimes in the Marcellus Shale have been identified, including underpressured, transitional (still underpressured), and normal to overpressured. In southern and south-central West Virginia, the Marcellus Shale and other shallower reservoirs have a significantly reduced pressure gradient, ranging from less than 0.10 to 0.25 psi/ft. The low-pressure area negatively impacts the production performance of the Marcellus Shale. Most wells in this area have been completed by explosive stimulation, foam fracs, or straight gas fracs, and nearly all are commingled with shallower reservoirs. The transitional pressure area of the Marcellus Shale is postulated to trend through central West Virginia, with an estimated pressure gradient of 0.25 to 0.40 psi/ft. Most of the Marcellus wells in this area are completed with large slick-water fracs, although foam fracs are not uncommon. The production performance from the recent Marcellus Shale vertical wells in this transitional trend is also negatively impacted with first-year cumulative production averaging less than 20 mmcfe per well.
Normal to overpressured gradients are proposed for much of the remaining parts of the Marcellus Shale play in north-central West Virginia and northward into Pennsylvania and the southern tier of New York. Pressure gradients in these areas are projected to range from approximately 0.43 to more than 0.80 psi/ft. It is also noted that a decline in the pressure gradient may exist along the eastern margins of the play, near the structural front, possibly caused by a combination of a lack of overlying seal integrity and/or a decrease in preserved organic material approaching the structural front. Based on the established successes of recent Marcellus Shale horizontal and vertical wells in northeastern Pennsylvania, southwestern Pennsylvania, and northern West Virginia, it is proposed that consistently high production volumes and high ultimate reserves in the Marcellus Shale will be mainly found in the areas that are normal to overpressured. The position of the Rome trough system is closely related to the areas of highest observed pressure gradients in the Marcellus Shale.
The cause of the decrease in pressure gradient in central and southern West Virginia in the Marcellus Shale is likely related to an inadequately developed seal or degradation of seal integrity by natural fracturing. Conversely, the normal and overpressured Marcellus Shale areas of the basin likely will have a well-developed and relatively noncompromised seal or seals, which served to retain most of the natural gas generated during thermal maturation. The seal integrity in northern West Virginia and western Pennsylvania was still not complete, as the Marcellus Shale and possibly other Devonian black shales were the source rock for most of the oil and gas produced in these areas in the Lower Devonian and younger reservoirs.[21]
Two possible theories are proposed to explain the pressure gradient changes. These theories reflect a close correlation between both the Middle Devonian Tully Limestone (C. Patterson, 2009, personal communication) and the deeper Silurian Salina Salt compared with the regional pressure profile. Figure 8 shows the outline of the limits of the Silurian Salina Salt overlain onto the regional pressure gradient map and exhibits a good correlation between the presence of thick Salina Salt and the normal- to high-pressure areas. The presence of a regional decollement in the Salina Group evaporites has been proposed[66][37][21] for the area underlain by the thick Salina Salt. This Salina decollement created an allochthonous block that was transported generally westward along low-angle detachment thrust faults. Shumaker[37] also proposed that south of the Salina pinch-out, the basal detachment zone occurred within the Devonian interval. It is proposed that this detachment and extensive movement in the Devonian section led to severe compromise of seals above the Marcellus Shale and subsequent loss of hydrocarbons and pressure.
Figure 9 is an overlay of the Tully Limestone isopach with the regional pressure gradient. This also shows an apparent correlation between the areas of normal or high pressure and the 20 ft thickness contour of the Tully Limestone. Based on the correlation between the Tully Limestone thickness and the limits of normal or overpressured Marcellus Shale, it can be proposed that the Tully Limestone may have been a factor in the trapping of the thermogenic produced gas from the Marcellus Shale. Alternately, this may be just a geologic coincidence, albeit an important one, where the deposition of the Tully Limestone was controlled by the position of the Rome trough. Recent tests of the shallower Rhinestreet, Genesee, and Burkett shales above the Tully Limestone have encountered overpressure gradients that suggest, at a minimum, that the seal is incomplete or that in some areas a separate hydrocarbon generation system exists above the Tully Limestone in the organic shales of the Genesee Group.
Marcellus Thickness Trends[edit]

Several older studies from the EGSP provide good regional overviews of the general thickness trends of the Marcellus Shale across the Appalachian Basin. In general, the most current industry drilling activity is associated with areas having greater than 15 m (gt50 ft) of gross Marcellus Shale thickness. These earlier studies all show a general eastward thickening of the Marcellus Shale within, or near, the Rome trough.
Figure 10 is a map of the gross thickness of the Marcellus Shale across the Appalachian Basin, as well as major mapped basement fault trends. The gross thickness of the Marcellus Shale as mapped is defined by the top of the first occurrence of organic shale near the base of the Mahantango Formation to the top of the Onondaga Limestone. The gross thickness of the Marcellus Shale increases generally eastward from the zero isopach in eastern Ohio and western West Virginia to a maximum thickness of more than 107 m (gt350 ft) in northeastern Pennsylvania. The trend of thickening generally parallels the Appalachian structural front, as shown in Figure 10. The gross thickness map has not been corrected for potentially repeated sections or areas that encounter significant bed dips. The gross depositional patterns of the Marcellus Shale appear likely to be influenced by basement fault patterns showing both a general strike-parallel thickening within the Rome trough and related strike-parallel basement faults. In addition, abrupt depositional terminations may exist at, or near, the cross-striking basement faults. Excellent reviews of the thickness trends of the Marcellus Shale and related intervals have been recently addressed by Lash and Engelder[13] and Boyce.[22]
Core Analysis: Porosity and Permeability[edit]

Considerable public and proprietary Marcellus Shale core data exist. Within the EGSP, several whole cores were taken in the main prospective trend of the Marcellus Shale. Data from these cores have been published in the EGSP studies and provide good summaries of various thermal maturity, geochemical, fracture, and rock mechanical data; but the cores were not effectively analyzed for porosity, permeability, and GIP estimates that represent the current standard for shale play analysis.
Early studies of the porosity and permeability of Appalachian Basin Devonian shales were mostly focused on the established Huron and Rhinestreet Shale plays associated with the Big Sandy field. These studies generally indicate the porosity of the eastern gas shales to be in the 1 to 5% range. One notable exception is the study of Soeder et al.,[67] who identified high porosity and permeability in the Marcellus Shale. Soeder et al.[67] reviewed the potential of the Marcellus Shale from the Eastern Gas Shales Project 7 WV well in Monongalia County, West Virginia, and reported high porosity (10–20%) and permeability (5–50 mud) in the Marcellus Shale and actually reported the Marcellus Shale to be the best of all of the reservoir rocks analyzed in their study. However, little or no industry interest was generated by this early report of high porosity and permeability in the Marcellus Shale.
Similar early evidence for enhanced porosity and permeability in the Marcellus Shale in southern New York was noted by Van Tyne,[9] who identified the Marcellus Shale as having pore systems that were better developed than the shallower Devonian shale intervals. He noted pore sizes as large as 0.001 mm and suggested that the presence of these pores may be a key factor in the productive potential of the Marcellus Shale. Initially, with the EGSP studies and follow-up investigations, most workers assumed that these organic-rich shales, although excellent sources of gas, made poor reservoirs because of their low anticipated porosity and permeability and lack of interconnected natural fractures. It was assumed that, based on the Big Sandy model of Devonian shale production, porosities in these shale members would be very low, averaging less than 5%.
Permeability data for the Marcellus Shale are very limited. As previously described, these early discoveries of high permeability, high porosity, and large gas storage capacity were important but did not generate significant industry interest in the Marcellus Shale as a viable reservoir target. Recent log and core data confirm that significant porosity and permeability are present across several large areas of the Marcellus Shale play. Observed porosity in the Marcellus Shale is much higher than that of the other Devonian shales in the Appalachian Basin, ranging from 5 to 15% in the southwestern parts of the play to 4 to 10% in the northeastern parts of the Marcellus Shale play. Data from wells drilled by Range Resources in Pennsylvania across the Marcellus Shale play have encountered a wide range of calculated permeabilities ranging from 130 to more than 2000 ηd. Most workers consider minimum values of commercial permeability in gas shales to be in excess of 100 ηd. Shale gas reservoirs with more than 500 ηd are considered very good. As such, the observed permeabilities in the Marcellus Shale play appear exceptional and unique compared with other North American gas-shale plays, with the exception of the Haynesville Shale play, where a similar high permeability is observed. Figure 11 shows an example of the pore structures from a core taken from the Marcellus Shale in southwestern Pennsylvania.
Gas in Place[edit]
A limited amount of GIP data from modern core and log analysis are available in the public domain. Based on various corporate press releases and conference calls, GIP estimates for the most active areas of the Marcellus Shale play range from 40 bcf/mi2 to more than 150 bcf/mi2. This compares favorably with other prominent shale plays such as the Barnett (50–200 bcf/mi2) and the Fayetteville (40–100 bcf/mi2). Modern core and log analyses now show the Marcellus Shale to have adequate to exceptional GIP. For its southwestern operations, Range Resources indicates that GIP in the Marcellus Shale interval ranges from 40 to more than 140 bcf/mi2 and averages 100 bcf/mi2. Cabot Oil and Gas represents average GIP figures for the Marcellus Shale to be 150 bcf/mi2 based on data from its main project area in Susquehanna County, Pennsylvania. Most of the current development of the Marcellus Shale appears to be associated with areas with GIP values of greater than 50 bcf/mi2.
Relationships between Open Fractures and Production[edit]
Devonian shales have been produced in the Big Sandy field of eastern Kentucky and southern West Virginia since the late 1920s. Within this field, tens of thousands of wells are currently producing from the Rhinestreet, upper and lower Huron, and the Cleveland shales. It is well documented that the primary controlling factor in this field is the presence of open natural fractures. Natural fractures may play a similar major function in influencing Marcellus Shale production, but their function appears more subtle, suggesting that although potentially significantly contributing to well or field performance, their role is less critical in defining commercial production when compared with the underpressured Big Sandy play. Pervasive fractures will likely be a detriment or barrier to well or field productivity. Although natural flows of gas from the Marcellus Shale have been reported for many of the thousands of Marcellus Shale penetrations located in the high-pressure area of the play, these reported shows characteristically blew down very quickly, suggesting a less well-developed open natural fracture network compared with productive areas of the Big Sandy field.
Clearly, a natural fracture network is present in the Marcellus Shale, as documented by various core and outcrop studies. Natural fracture networks clearly have a function in the Marcellus Shale both regionally and locally. Based on available data, it is proposed that the Marcellus Shale is regionally controlled by reservoir characteristics, including thickness, porosity, permeability, GIP, pressure gradient, and finally, the ability to be fractured, thus more closely resembling the Barnett Shale play instead of the Big Sandy model. Natural fractures are an important element in the commercial development of the Marcellus Shale on both a local- and field-level basis. Several potential geologic scenarios where higher initial test rates are observed in vertical and horizontal wells can be demonstrated to be related to the presence of natural fracture systems. However, once natural fracturing systems develop to a point where effective stimulation is compromised or reservoir seal is compromised over time, then their function changes from one of enhancement to one of detriment. Furthermore, a relatively unfractured Marcellus Shale interval can have sufficient GIP with limited natural fractures but can be successfully stimulated to achieve commercial rates of production. The comparison here is with the Big Sandy field, where the presence of natural fractures is critical for commercial development even before artificial stimulation.
Evidence that the regional productive characteristics of the Marcellus Shale are not dominated by natural fracturing includes these indications:
- A review of drilling records and measured natural flow rates for historic penetrations of the Marcellus Shale indicate that most documented shows had a tendency to blow down quickly and were not sustainable. For comparison, natural completions in the Big Sandy field exist and, until the advent of hydraulic fracturing, it was commonplace in that field for wells that demonstrated natural flows of greater than 0.300 mmcfpd to be completed naturally without any method of stimulation. Similar occurrences have not been demonstrated yet in the Marcellus Shale play.
- A review of mud log data for Marcellus wells indicates large shows while drilling through the Marcellus Shale that decline rapidly once the underlying Onondaga Sandstone and Huntersville Chert sections are penetrated.
- Open natural fractures are rarely observed in whole cores of the Marcellus Shale or in Fullbore Formation MicroImager (FMI™, manufactured by Schlumberger) logs. Most observed natural fractures are calcite cemented and healed.
- On a broad scale, most of the current activities in southwestern Pennsylvania and northern West Virginia are situated in relatively uncomplicated structural regions.
- The overpressured part of the Marcellus Shale play can be partially attributed to its position north of the Salina Salt pinch-out, where the ductile beds of the deeper Salina Formation are pervasive. Here, during Alleghenian thrusting, much of the early and basinal accommodation was provided by the deformation of the Salina and then to a lesser extent the overlying Devonian shales. In the no-salt areas south of the Burning Springs feature and especially in southern West Virginia and Kentucky, the organic Devonian shale acted as the most ductile beds and hence experienced much more deformation and natural fracturing. This is believed to be one of the causal mechanisms for the productive capabilities of the shale in the Big Sandy field and the underpressured profile of the Marcellus Shale and other upper Devonian shales.
- The original EGSP studies clearly distinguished the more fractured nature of the Big Sandy field as compared with the northern Appalachian areas and associated Marcellus Shale play.
Discussion of vertical wells and horizontal wells[edit]

Unlike the Barnett Shale play that was characterized by a long period of vertical well drilling followed by a rapid expansion into horizontal drilling, the Marcellus Shale play appears to be characterized by a quick switch from vertical drilling to horizontal drilling. Nearly all horizontal wells drilled in the Marcellus Shale play are oriented along a northwest–southeast azimuth. Current direction of maximum horizontal principal stress (SHmax) for the Appalachian Basin is northeast to southwest based on numerous studies by the EGSP, the world stress map, microseismic studies, and observed direction of drilling-induced fractures observed in cores and FMI logs for the Marcellus Shale and other EGSP wells. These are shown in [[:[File:M97Ch4FG12.jpg|Figure 12]]. As such, the northwest–southeast azimuth is the primary orientation for most horizontal Marcellus wells.
It is anticipated that vertical wells will continue to be drilled in the future, particularly in northern West Virginia, because of a combination of severe topography that limits the size of locations and supporting infrastructure and also lease positions that include small tracts unsuited for horizontal drilling compounded by the lack of forced unionization.
The observed outcrop fracture patterns in the Devonian shales and Marcellus Shale have been extensively studied and discussed during the last few years. Lash and Engelder[13] and Engelder et al.[69] proposed both a formal terminology (J1, J2, J3, etc.) and causal mechanism for observed joint directions in Marcellus Shale outcrops. The observed J1 fracture set is oriented predominantly in a northeast–southwest direction. These joints appear to closely parallel the observed or inferred SHmax direction.
The FMI logs run primarily in southwestern Pennsylvania in the Devonian shale interval tend to favor a strong northwest–southeast orientation for healed fractures. The analysis of FMI patterns on several wells operated by Range Resources drilled between 2004 and 2009 shows the following types of fracture patterns:
- Drilling-induced fractures that trend northeast to southwest, paralleling the inferred SHmax direction.
- Healed fractures defined by high-resistivity patterns trend primarily northwest to southeast, paralleling the J2 set proposed by Engelder et al.[69] and many of the fracture patterns observed in the EGSP cores.
- Possible faults and fractures with varying orientations show good representation of the proposed J1 and J2 fracture sets. Other orientations also are well represented and are believed to represent features associated with slickensides (low-angle) and high-angle faults and fractures.
This preliminary work summarized in [[:[File:M97Ch4FG12.jpg|Figure 12]] strongly supports observations by Engelder[70] and Engelder et al.[69] that the J2 fracture set (northwest–southeast) observed in outcrop is also well represented in the subsurface. The J1 sets are not quite as well represented by FMI data. However, considerable indirect evidence is present for open fractures existing in a northeast–southwest azimuth based on observed interference patterns between offset wells during fracturing operations. During fracturing operations, the primary direction of interference occurs along a northeast–southwest azimuth. Although lacking in core and formation-imaging logs, this provides significant evidence to support the presence, at least locally, of a J1 set in the subsurface of the Marcellus interval.
Key production areas[edit]
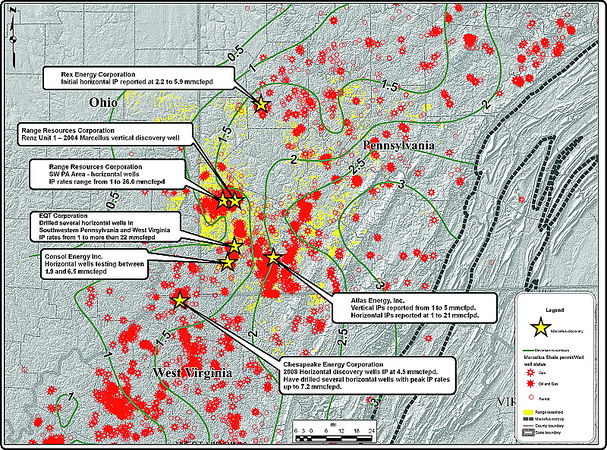
Figure 13 A map of the southwestern part of the Marcellus Shale play depicting key discovery wells and selected well information. IP = Initial potential; SW PA = southwestern Pennsylvania; mmcfpd = million cubic feet (gas) per day; mmcfepd = million cubic feet (gas equivalents) per day.
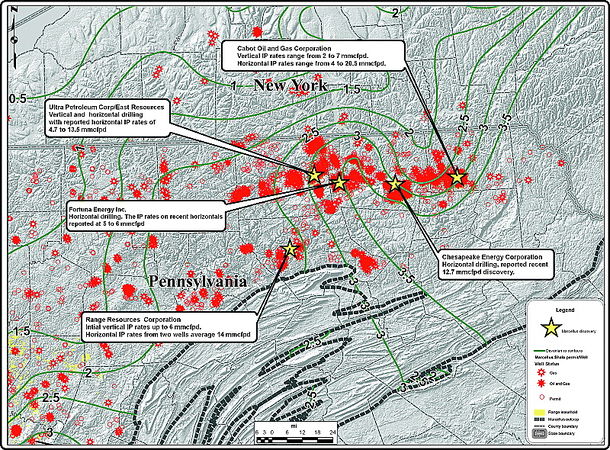
Figure 14 A map of the northeastern part of the Marcellus Shale play depicting key discovery wells and selected well information. IP = Initial potential; mmcfpd = million cubic feet (gas) per day.


The Marcellus Shale play is still in its early stages of development, and official production data are very limited. Several publicly traded companies have provided production data via news releases and quarterly reports. These early data provide good indications that the Marcellus production achieved to date compares favorably with other developing shale plays, including the Barnett, Fayetteville, Woodford, and Haynesville. The maximum reported daily rate of production to date is 26.5 mmcfepd from a horizontal completion in Washington County, Pennsylvania. Reported daily test rates from vertical wells in Pennsylvania and northern West Virginia are less than 0.100 mmcfpd to reported high rates of 2.0 to 6.0 mmcfpd.
Two major core areas are developing in the Marcellus Shale play. These include a southwestern region comprising parts of northern West Virginia and southwestern Pennsylvania and a second core area located primarily in northeastern Pennsylvania. Figure 13 shows the major part of the southwestern core area of the Marcellus with key wells, test rates, and thermal maturity. Well results in this area for vertical wells range from 0.100 mmcfepd to more than 5.0 mmcfepd, and horizontal well results range from 1.0 mmcfepd to more than 26.0 mmcfepd (Range Resources Corporation, 2010). In this southwestern area, the Marcellus Shale has a gross thickness of 18 to 45 m (60–150 ft) with high porosity, TOC percentage, and permeability and is located west of the major fold-belt structures of the Appalachian Basin. In the western parts of the southwestern play, thermal maturity is lower and significant natural gas liquid (NGL) production is associated with wells drilled in this area.
Figure 14 shows the major part of the northeastern core area of the Marcellus Shale with key wells, test rates, and thermal maturity. In the northeastern core area, vertical well performance has ranged from 0.100 to more than 7.0 mmcfpd, and horizontal well performance has ranged from 1.0 to more than 18.0 mmcfpd. In the northeast core area, the Marcellus Shale attains a gross play interval of 60 to 105 m (200–350 ft), has a Btu content of 1000 to 1050 because of the elevated thermal maturity levels, and is generally more structurally complicated than the southwestern play area. Both areas appear to be consistently overpressured and have relatively comparable reserve potential based on reported flow rates and estimated ultimate recovery estimates.
The July 27, 2009, issue of the Gene Powell Newsletter identifying the top 868 Barnett Shale wells out of a database of 8266 wells indicated that the average peak 30-day actual production tests for these top tier wells range from 3.0 to more than 10.0 mmcfepd.[71] Although the Marcellus Shale play is in its infancy compared with the maturing Barnett Shale play, reported IP rates (commonly actual 30-day production tests) for the Marcellus range from 1.0 to more than 26.0 mmcfepd. This suggests that the extent of sweet spots in the Marcellus Shale play are considerably larger than the Barnett Shale play and that well performance on an average or playwide basis is at least equal if not superior to that of the Barnett Shale.
Reserve potential[edit]

Enormous volumes of gas are present in Devonian black shales of the Appalachian Basin. Early studies of the entire play estimated a GIP of 2657 tcf for all shale intervals.[61] Reserve estimates specifically for the Marcellus Shale play were historically lower because of the concept that the Marcellus Shale was thinner and less fractured than productive intervals in the Big Sandy field. Recent estimates for the recoverable reserve potential for the modern Marcellus Shale play fall in a broad range of 2.1 to 867 tcf with the currently most accepted estimates being in the range of 220 to 489 tcf.[5] With recent reserve estimates of this scope, Engelder and Lash[73] provided early recognition of the world-class potential of this resource.
The Marcellus Shale is a continuous-type gas accumulation and, when fully developed, will consist of a large continuous field or series of fields. Figure 15 is a listing of the top 15 gas fields in the world.[72] The reserve potential for these top fields ranges from 40 to 1400 tcf. When even the lowest of the recent reserve estimates for the Marcellus are compared with these top worldwide fields, the true potential and scope of the Marcellus Shale are apparent.
Outstanding geologic issues[edit]
The most prospective areas of the Marcellus Shale are being delineated and expanded at an ever-accelerating rate, and much of the risk, both geologic and technical, has been identified and addressed. Some of the remaining technical risks and unanswered questions to the play may include those listed below:
- Structural complexity. Risks where hydrofracturing near faults is ineffective and similar to the highly faulted areas identified in the Barnett, Fayetteville, and similar shale plays.
- Associated water production from deeper zones. Many established Huntersville Chert and Oriskany Sandstone fields have a water drive component that needs to be addressed when development of the Marcellus Shale is considered in specific structural settings and trends.
- Wellbore stability and lateral landing issues. Hole stabilization issues are yet to be fully defined when horizontal drilling is considered. Where are the best landing zones to target and why?
- Fracturing and faulting issues. When and where do these features enhance production or act as detriments influencing completion effectiveness and borehole stability? Should fractured areas be targeted or avoided? Where is the distinction made?
- Role of two-dimensional and three-dimensional seismic in drilling. Many areas are being developed without seismic coverage because of operator choice, logistics, or other considerations. This lack of structural knowledge clearly enhances the technical risk.
- Thermal maturity risks. At what level of maturity does the Marcellus Shale cease to be commercially viable? Is there an oil play similar to the Bakken trend? Can commercial production be found in high Ro areas, where the thermal maturity is in excess of 3.5% Ro, where surface data suggest the presence of coal in the semianthracite rank?
- Where are the future core areas for Marcellus Shale development that have not been identified? Are the northeastern and southwestern current core areas the best in the Marcellus Shale or are there future core regions that could rival or exceed those established producing areas to date?
- Is there a viable underpressured Marcellus horizontal play similar to the Huron Shale and Big Sandy field play?
Summary and contents[edit]
After a long history as a major source rock for several major Appalachian Basin oil and gas plays, the Marcellus Shale is now emerging as a major thermogenic shale-gas play with a large areal extent. After initial vertical discoveries in 2004 through 2006 and horizontal successes initiated in 2007, the Marcellus Shale play is rapidly expanding as industry players establish and develop their acreage positions. The initial reported production tests are impressive, ranging from 1.0 to more than 26.5 mmcfepd for horizontal completions. Basement structure is an important factor in the thermal history of the Marcellus Shale play; it influences thickness trends, and is closely related to the overpressured region identified in the Marcellus Shale. In addition, both the presence of the underlying Salina Formation and the overlying Tully Limestone may have been a significant factor in the establishment and preservation of the overpressured region in the Marcellus Shale. The Marcellus Shale thickens in the northeastern part of the play, but porosity and permeability trends favor the southwestern part of the play. Natural fracturing clearly is a factor in Marcellus Shale productivity but not to the degree observed in the underpressured Big Sandy field. The TOC content for the Marcellus Shale is very high compared with other established North American shale plays and clearly is a factor in the development of porosity, permeability, and gas content. Reserve estimates for the Marcellus Shale play have grown exponentially in the last few years, and modern estimates now range from a low of 50 to more than 800 tcf.[5] This range clearly places the potential of the Marcellus Shale in the world-class category.
References[edit]
- ↑ 1.0 1.1 de Witt Jr., W., 1986, Devonian gas-bearing shales in the Appalachian Basin, in C. W. Spencer and R. F. Mast, eds., Geology of tight-gas reservoirs: AAPG Studies in Geology 24, p. 1–8.
- ↑ 2.0 2.1 Wrightstone, G. R., 2008, Marcellus Shale: Regional overview from an industry perspective (abs.): AAPG Eastern Section Meeting.
- ↑ Wrightstone, G. R., 2009, Marcellus Shale: Geologic controls on production (abs.): AAPG Search and Discovery article 10206.
- ↑ 4.0 4.1 Milici, R. C., 2005, Assessment of undiscovered natural gas resources in Devonian black shales, Appalachian Basin, eastern U.S.A.: U.S. Geological Survey Open-File Report 2005-1268 version 1.0.
- ↑ 5.0 5.1 5.2 5.3 Engelder, T., 2009, Marcellus 2008: Report card on breakout year for gas production in the Appalachian Basin: Fort Worth Basin Oil and Gas Magazine, p. 18–22.
- ↑ National Energy Technology Laboratory, 2007, Archive of unconventional gas resources program.
- ↑ Harper, J. A., 2008, The Marcellus Shale: An old “new” gas reservoir in Pennsylvania: Pennsylvania Geology, v. 38, no. 1, p. 2–13.
- ↑ Morris, L. J., 2008, Horizontal development in the Appalachian Basin Devonian shale: AAPG 2008 Eastern Section Meeting (abs.).
- ↑ 9.0 9.1 Van Tyne, A. M., 1993, Detailed study of Devonian black shales encountered in nine wells in western New York state, in J. B. Roen and R. C. Kepferle, eds., 1993, Petroleum geology of the Devonian and Mississippian black shale of eastern North America: U.S. Geological Survey Bulletin, v. 1909, p. M1–M16.
- ↑ Cabot Oil and Gas, 2009, Cabot Oil and Gas Corporation discussion handout: Enercom 2009 Oil and Gas Conference.
- ↑ Range Resources Corporation, 2010, Range Resources Company Presentation, August 2010.
- ↑ Patchen, D. G., K. L. Avary, and R. B. Erwin, 1985, Correlation of Stratigraphic Units of North America (COSUNA) project-Northern Appalachian Region: American Association of Petroleum Geologists, 1 sheet.
- ↑ 13.0 13.1 13.2 Lash, G. G., and T. Engelder, 2008, Marcellus Shale subsurface stratigraphy and thickness trends: Eastern New York to northeastern West Virginia (abs.): AAPG Eastern Section Meeting.
- ↑ Piotrowski, R. G., S. A. Krajewski, and L. Heyman, 1977, Stratigraphy and gas occurrence in the Devonian organic-rich shales of Pennsylvania, in G. L. Schott, W. K. Overbey Jr., A. E. Hunt, and C. A. Komar, eds., Preprints, First Eastern Gas Shales Symposium, U.S. Energy Research and Development Administration, Morgantown Energy Research Center, Morgantown, West Virginia, p. 77–94.
- ↑ 15.0 15.1 Lash, G. G., 2008, Stratigraphy and fracture history of the Middle and Upper Devonian succession, western New York: Significance to basin evolution and hydrocarbon exploration: Pittsburgh Association of Petroleum Geologists spring field trip guidebook, 88 p.
- ↑ de Witt Jr., W., J. B. Roen, and L. G. Wallace, 1993, Stratigraphy of Devonian black shales and associated rocks in the Appalachian Basin, in J. B. Roen and R. C. Kepferle, 1993, Petroleum geology of the Devonian and Mississippian black shale of eastern North America: U.S. Geological Survey Bulletin, v. 1909, p. M1–M16.
- ↑ 17.0 17.1 17.2 Werne, J. P., B. B. Sageman, T. W. Lyons, and D. J. Hollander, 2002, An integrated assessment of a “type euxinic” deposit: Evidence for multiple controls on black shale deposits in the Middle Devonian Oatka Creek Formation: American Journal of Science, v. 302, p. 110–143, doi:10.2475/ajs.302.2.110.
- ↑ Lash, G. G., 2009a, The Middle Devonian Marcellus Shale: A record of eustasy and basin dynamics: AAPG Search and Discovery article 90090.
- ↑ Lash, G. G., 2009b, Sequence-stratigraphic framework of the Middle Devonian Marcellus Shale (abs.): AAPG 2009 Eastern Section Meeting
- ↑ 20.0 20.1 Hamilton-Smith, T., 1993, Stratigraphic effects of the Acadian orogeny in the autochthonous Appalachian Basin, in D. C. Roy and J. W. Skehan, eds., The Acadian orogeny: Recent studies in New England, Maritime Canada, and the authochthonous foreland: Geological Society of America Special Paper 275, p. 153–164.
- ↑ 21.0 21.1 21.2 Milici, R. C., and C. S. Swezey, 2006, Assessment of Appalachian Basin oil and gas resources: Devonian shale–Middle and Upper Paleozoic total petroleum system: U.S. Geological Survey Open-File Report Series 2006-1237.
- ↑ 22.0 22.1 Boyce, M. L., 2009, Lithostratigraphy and petrophysics of the Marcellus interval in West Virginia and southwestern Pennsylvania (abs.): AAPG 2009 Eastern Section Meeting, p. 34–35.
- ↑ 23.0 23.1 23.2 Blakey, R., 2005, Global paleogeography.
- ↑ 24.0 24.1 Ettensohn, F. R., 1985a, The Catskill delta complex and the Acadian orogeny: A model, in D. W. Woodrow and W. D. Sevon, eds., The Catskill delta: Geological Society of America Special Paper 201, p. 39–49.
- ↑ 25.0 25.1 25.2 25.3 25.4 Ettensohn, F. R., 1985b, Controls on development of Catskill delta complex basis facies, in D. W. Woodrow and W. D. Sevon, eds., The Catskill delta: Geological Society of America Special Paper 201, p. 65–77.
- ↑ 26.0 26.1 26.2 Ettensohn, F. R., 1992, Controls on the origin of the Devonian–Mississippian oil and gas shales, east-central United States: Fuel, v. 71, p. 1487–1492, doi:10.1016/0016-2361(92)90223-B.
- ↑ Ettensohn, F. R., 2004, Modeling the nature and development of major Paleozoic clastic wedges in the Appalachian Basin, U.S.A.: Journal of Geodynamics, v. 37, p. 657–681, doi:10.1016/j.jog.2004.02.009.
- ↑ Williams, H., and R. D. Hatcher, 1982, Suspect terranes and accretionary history of the Appalachian orogen: Geology, v. 10, p. 530–536, doi:10.1130/0091-7613(1982)102.0.CO;2.
- ↑ Woodrow, D. L., F. W. Fletcher, and W. F. Ahrnsbrak, 1973, Paleogeography and paleoclimate at the deposition sites of the Devonian Catskill and Old Red Facies: Geological Society of America Bulletin, v. 84, p. 3051–3063, doi:10.1130/0016-7606(1973)842.0.CO;2.
- ↑ 30.0 30.1 30.2 30.3 Sageman, B. B., A. E. Murphy, J. P. Werne, C. A. Ver Straeten, D. J. Hollander, and T. W. Lyons, 2003, A tale of shales: The relative role of production, decomposition, and dilution in the accumulation of organic-rich strata, Middle–Upper Devonian, Appalachian Basin: Chemical Geology, v. 195, p. 229–273.
- ↑ Murphy, A. E., 2000, Physical and biochemical mechanisms of black shale deposition, and their implications for ecological and evolutionary change in the Devonian Appalachian basin: Ph.D. dissertation, Northwestern University, Evanston, Illinois, 363 p.
- ↑ Demaison, G. J., and G. T. Moore, 1980, Anoxic environments and oil source bed genesis: AAPG Bulletin, v. 64, p. 1179–1209.
- ↑ 33.0 33.1 Macquaker, J., D. McIlroy, S. J. Davies, and M. A. Keller, 2009, Not anoxia! How do you preserve organic matter then? (abs.): AAPG 2009 Annual Convention and Exhibition.
- ↑ Boyce, M., and T. Carr, 2010, Stratigraphy and petrophysics of the Middle Devonian black shale interval in West Virginia and southwest Pennsylvania: Poster presented at AAPG Denver ACE 2010.
- ↑ Woodrow, D. L., and W. D. Sevon, eds., 1985, The Catskill delta: Geological Society of America Special Paper 201, 246 p.
- ↑ Wrightstone, G. R., 2010, Bloomin' algae! How paleogeography and algal blooms may have significantly impacted deposition and preservation of the Marcellus Shale: Pittsburgh Association of Petroleum Geologists.
- ↑ 37.0 37.1 37.2 37.3 37.4 Shumaker, R. C., 1996, Structural history of the Appalachian Basin, in J. B. Roen and B. J. Walker, eds., The atlas of major Appalachian gas plays: Morgantown, West Virginia, West Virginia Geological and Economic Survey Publication V-25, p. 8–10.
- ↑ 38.0 38.1 Colton, G. W., 1970, The Valley and Ridge and Appalachian plateau; stratigraphy and sedimentation; the Appalachian Basin; its depositional sequences and their geologic relationships, in G. W. Fisher, F. J. Pettijohn, and J. C. Reed Jr., eds., Studies of Appalachian geology, central and southern: New York, Interscience Publishers, p. 5–47.
- ↑ 39.0 39.1 Frey, M. G., 1973, Influence of Salina Salt on structures in New York-Pennsylvania part of the Appalachian Plateau: AAPG Bulletin, v. 57, p. 1027–1037.
- ↑ 40.0 40.1 Sanford, B. V., 1993, St. Lawrence platform: Economic geology, in D. F. Stott and J. D. Aitken, eds., Sedimentary cover of the craton in Canada: Boulder, Colorado, Geological Society of America, The Geology of North America, v. D-1, p. 787–798.
- ↑ 41.0 41.1 41.2 41.3 Harper, J. A., and C. D. Laughrey, 1987, Geology of the oil and gas fields of southwestern Pennsylvania: Commonwealth of Pennsylvania Mineral Resource Report 87, p. 91–97.
- ↑ Negus-deWyss, J., 1979, The eastern Kentucky gas field: A geological study of the relationship of oil shale gas occurrence to structure, stratigraphy, lithology, and inorganic geochemical parameters: Ph.D. dissertation, West Virginia University, Morgantown, West Virginia, 199 p.
- ↑ Lee, K. D., 1980, Subsurface structure of the eastern Kentucky gas field: Master's thesis, West Virginia University, Morgantown, West Virginia, 52 p.
- ↑ 44.0 44.1 Shumaker, R. C., 1993, Structural parameters that affect Devonian shale gas production in West Virginia and eastern Kentucky, in J. B. Roen and R. C. Kepferle, eds., 1993, Petroleum geology of the Devonian and Mississippian black shale of eastern North America: U.S. Geological Survey Bulletin, v. 1909, p. K1–K38.
- ↑ Scanlin, M. A., and T. Engelder, 2003, The basement versus the no-basement hypothesis for folding within the Appalachian Plateau Detachment Sheet: American Journal of Science, v. 303, 519–563 p.
- ↑ 46.0 46.1 Kulander, C. S., and R. T. Ryder, 2005, Regional seismic lines across the Rome Trough and Allegheny Plateau of northern West Virginia, western Maryland, and southwestern Pennsylvania: U.S. Geological Survey Geologic Investigations Series Map I-2791.
- ↑ Boswell, R., 1985, Stratigraphy and sedimentation of the Acadian clastic wedge in northern West Virginia: Master's thesis, West Virginia University, Morgantown, West Virginia, 179 p.
- ↑ Murin, T. M., 1988, Sedimentology and structure of the First Bradford Sandstone in the Pennsylvania plateau province: Master's thesis, University of Pittsburgh, Pittsburgh, Pennsylvania, 95 p.
- ↑ Flaherty III, T., 1994, Stratigraphy of the Upper Devonian Bradford Group in southwestern Pennsylvania: A hierarchical classification of cyclic transgressive-regressive units: Master's thesis, University of Pittsburgh, Pittsburgh, Pennsylvania, 96 p.
- ↑ Wheeler, R. L., 1980, Cross-strike structural discontinuities: Possible exploration tool for natural gas in Appalachian overthrust belt: AAPG Bulletin, v. 64, no. 12, p. 2166–2178.
- ↑ Canich, M. R., and D. P. Gold, 1977, A study of the Tyrone-Mt. Union lineament by remote sensing techniques and field methods: State College, Pennsylvania, The Pennsylvania State University Office of Remote Sensing and Earth Resources (ORSER) Technical Report 120-137, 59 p.
- ↑ 52.0 52.1 Rodgers, M. R., and T. H. Anderson, 1984, Tyrone-Mt. Union cross-strike lineament of Pennsylvania: A major Paleozoic basement fracture and uplift boundary: AAPG Bulletin, v. 68, p. 92–105.
- ↑ Lavin, P. M., D. L. Chaffin, and W. F. Davis, 1982, Major lineaments and the Lake Erie–Maryland crustal block: Tectonics, v. 1, p. 431–440, doi:10.1029/TC001i005p00431.
- ↑ 54.0 54.1 Repetski, J. E., R. T. Ryder, J. A. Harper, and M. H. Trippi, 2002, Thermal maturity patterns (CAI and % Ro) in the Ordovician and Devonian rocks of the Appalachian Basin in Pennsylvania: U.S. Geological Survey Open-File Report 2002-302, 57 p.
- ↑ Faill, R. T., 1985, The Acadian orogeny and the Catskill delta, in D. W. Woodrow and W. D. Sevon eds., The Catskill delta: Geological Society of America Special Paper 201, p. 15–37.
- ↑ Weary, D. J., R. T. Ryder, and R. Nyahay, 2000, Thermal maturity patterns (CAI and % Ro) in the Ordovician and Devonian rocks of the Appalachian Basin in New York state: U.S. Geological Survey Open-File Report 2000-496, 39 p.
- ↑ Repetski, J. E., R. T. Ryder, K. L. Avary, and M. H. Trippi, 2005, Thermal maturity patterns (CAI and % Ro) in the Ordovician and Devonian rocks of the Appalachian Basin in West Virginia: U.S. Geological Survey Open-File Report 2005-1078, 72 p.
- ↑ Rowan, E. L., R. T. Ryder, J. L. Repetski, M. H. Trippi, and L. F. Ruppert, 2004, Initial results of a 2-D burial/thermal history model, central Appalachian Basin, Ohio and West Virginia: U.S. Geological Survey Open File Report 2004-1445, 37 p.
- ↑ Rowan, E. L., 2006, Burial and thermal history of the central Appalachian Basin, based on three 2-D models of Ohio, Pennsylvania, and West Virginia: U.S. Geological Survey Open File Report 2006-1019, 35 p.
- ↑ Nyahay, R., J. Leone, L. B. Smith, J. P. Martin, D. J. Jarvie, 2007, Update on regional assessment of gas potential in the Devonian Marcellus and Ordovician Utica shales of New York: Search and Discovery Article 10136.
- ↑ 61.0 61.1 Zielinski, R. E., and R. D. McIver, 1982, Resources and exploration assessment of the oil and gas potential in the Devonian gas shales of the Appalachian Basin: U.S. Department of Energy, Morgantown Energy Technology Center, DOE/DP/0053-1125, p. 326.M
- ↑ Jarvie, D. M., R. J. Hill, and R. M. Pollastro, 2005, Assessment of the gas potential and yields from shales: The Barnett Shale model, in Unconventional energy resources in the southern midcontinent, 2004 symposium: Oklahoma Geological Survey Circular 110, p. 37–50.
- ↑ Reed, J. R., and D. Dunbar, 2008, Using ArcGIS to estimate thermogenic gas generation volumes by Upper and Middle Devonian shales in the Appalachian Basin (abs.): AAPG Eastern Section meeting.
- ↑ Schmoker, J. W., 1981a, Determination of organic-matter content of Appalachian Devonian shales from gamma-ray logs: AAPG Bulletin, v. 65, no. 7, p. 1285–1298.
- ↑ Schmoker, J. W., 1981b, Organic-matter content of Appalachian Devonian shales determined by use of wire-line logs: Summary of work done 1976–80: U.S. Department of the Interior Geologic Survey, Open-File Report, p. 81–181.
- ↑ Gwinn, V. E., 1964, Thin-skinned tectonics in the Plateau and northwestern Valley and Ridge provinces of the central Appalachians: Geological Society of America Bulletin, v. 75, no. 9, p. 863–900, doi:10.1130/0016-7606(1964)75[863:TTITPA]2.0.CO;2.
- ↑ 67.0 67.1 Soeder, D. J., P. L. Randolph, and R. D. Matthews, 1986, Porosity and permeability of eastern Devonian gas shale: Institute of Gas Technology, U.S. Department of Energy, Morgantown Energy Technology Center, DOE/METC/20342-8, 75 p.
- ↑ Heidbach, O., M. Tingay, A. Barth, J. Reinecker, D. Kurfebeta, and B. Muller, 2008, The world stress map based on the database release 2008, equitorial scale 1:46,000,000: Paris, Commission for the Geological Map of the World, doi:10.1594/GFZ.WSM.Map2009.
- ↑ 69.0 69.1 69.2 Engelder, T., G. G. Lash, and R. S. Uzcategui, 2009, Joint sets that enhance production from Middle and Upper Devonian gas shales of the Appalachian Basin: AAPG Bulletin, v. 93, no. 7, p. 857–889, doi:10.1306/03230908032.
- ↑ Engelder, T., 2008, Structural geology of the Marcellus and other Devonian gas shales: Geological conundrums involving joints, layer-parallel shortening strain, and the contemporary tectonic stress field: Field Guidebook for Pittsburgh Association of Petroleum Geologists Field Trip (September 12–13, 2008) and for the AAPG-SEC Eastern Section Meeting Field Trip (October 11–12, 2008), 91 p.
- ↑ Powell, M. E., and W. Brackett, 2009, Best Barnett Shale wells based on peak month daily average: Powell Barnett Shale Newsletter, July 2009, p. 9.
- ↑ 72.0 72.1 Sandrea, R., 2006, Global natural gas reserves: A heuristic viewpoint (part 1 of 2): Middle East Economic Survey, v. 49, no. 11.
- ↑ Engelder, T., and G. G. Lash, 2008, Marcellus shale play's vast resource potential creating stir in Appalachia: American Oil and Gas Reporter, v. 51, no. 6, p. 76–87.
- Repetski, J. E., R. T. Ryder, D. J. Weary, A. G. Harris, and M. H. Trippi, 2008, Thermal maturity patterns (CAI and % Ro) in the Ordovician and Devonian rocks of the Appalachian Basin: A major revision of U.S. Geological Survey Map I-917 using new subsurface collections: U.S. Geological Survey Scientific Investigations Map 3006.