Biostratigraphy in sequence stratigraphy
| Exploring for Oil and Gas Traps | |

| |
| Series | Treatise in Petroleum Geology |
|---|---|
| Part | Predicting the occurrence of oil and gas traps |
| Chapter | Applied paleontology |
| Author | Robert L. Fleisher, H. Richard Lane |
| Link | Web page |
| Store | AAPG Store |
Sequence stratigraphy is the study of genetically related facies within a framework of chronostratigraphically significant surfaces.[1] Paleontologic data, integrated with seismic and well log data, are an integral part of sequence stratigraphic analysis. Paleontology provides two critical types of data:
- Age control for chronostratigraphic horizons, especially sequence boundaries
- Paleoenvironmental control for systems tract interpretations
Age control[edit]
Among chronostratigraphically significant surfaces, the sequence boundary and the maximum flooding surface (i.e., downlap surface on seismic profiles) are of particular importance. Paleontology provides two important constraints on these surfaces:
- Chronostratigraphic correlation controls[2]
- Numerical ages for rate-dependent analyses
Chronostratigraphic correlation[edit]
The sequence stratigraphy model postulates a worldwide succession of depositional events such as coastal onlap and oceanic anoxic events[3] primarily reflecting global cyclic changes in eustatic sea level. This succession ideally is represented by a sea level onlap-offlap curve such as the Haq et al.[4] cycle chart.
One problem frequently confronted in sequence studies is determining which of these worldwide events is represented in the section of interest. Correlating a local section to the global cycles requires accurate and precise biostratigraphy, either through zonal age determination or by providing the necessary age constraints on magnetostratigraphic or isotope stratigraphic interpretations. When based on reliable age control, correlation with the succession of global processes can be a valuable predictive stratigraphic tool for understanding the temporal and areal distribution of reservoir, source, and seal rocks.
Biostratigraphic correlation between sections separated by a fault zone or other major geologic feature is frequently much more reliable than seismic reflectors or well log picks. Correlation across growth faults, where stratal thickness and character can vary greatly from the high to the low side, is a notable example.
Stratigraphic distribution of onlap events[edit]

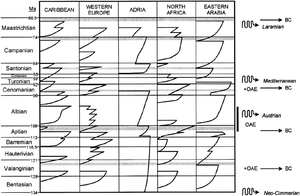
Figure 1 illustrates the stratigraphic distribution of onlap events, tectonic episodes (“s”-shaped arrows), oceanic anoxic events (OAE), and “crises” of the shallow water biota (BC) in various parts of the world during part of the Mesozoic.[5] Landward is toward the right in each column.
Numerical ages[edit]
Rate-dependent analyses such as subsidence analysis, deposition rate, and maturation modeling require age-depth pairs as input data. Numerical ages are critical to accurate analyses and ideally should be based on high-resolution biostratigraphic control calibrated to a standard geochronology, such as Harland et al.[6] Berggren et al.[7] or Gradstein et al.[8]
Systems tract interpretation[edit]

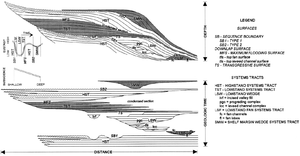
A |systems tract (ST) is a linkage of contemporaneous, three-dimensional arrays of lithofacies.[9][10] Figure 2 shows depositional systems tracts and the bounding surfaces of a stratigraphic sequence depositional model.
Fossil assemblages in the systems tract[edit]
In addition to the lithological features, systems tracts can possess distinctive fossil assemblages, although the composition of the population varies, depending on the sample location relative to the ST profile. The vertical succession of STs can be delineated by trends in the distribution, abundance, and diversity of fossil taxa and morphologic groups. Environmental changes within and between systems tracts may reflect changes in sea level, sedimentation, and tectonics. The general paleontological characteristics of systems tracts are as follows.
| Systems Tract | Characteristics |
|---|---|
| Lowstand fan (basin floor fan) | Basin to slope, with a strong component of terrigenous input; fossils commonly include specimens that have been reworked or redeposited from upslope, with pelagic forms typically in shales between stacked lobes |
| Lowstand wedge (slope fan and prograding complex) | Shallow environment compared to underlying strata; upward shoaling and increasing terrestrial input, with reworked and redeposited fossils |
| Shelf-margin wedge | Shallower environment than underlying strata with little vertical environmental change within the systems tract |
| Transgressive | Increasing water depth and decreasing terrestrial influence upward to the maximum flooding surface at the top of this systems tract |
| Highstand | Progressive decrease in water depth; marine fossils upsection shallower than underlying strata; assemblages commonly shallow to inner shelf, marginal marine, or continental except in basinal locations |
Paleoenvironmental trends[edit]
In addition to seismic, lithofacies, and well log signatures[1] sequence stratigraphic surfaces and systems tracts can be recognized from paleoenvironmental trends evident from several types of paleontologic analyses:
- Paleobathymetry—changes in benthic faunal composition can help identify relative sea level changes, e.g., benthic foraminiferal biofacies[11]
- Distance from shoreline—changes in the relative abundance of marine vs. land-derived forms (e.g., dinoflagellate-pollen ratios) may reflect shoreline advances and retreats
- Climatic cycles—fluctuations of warm- and cold-water indicators in marine environments [e.g., calcareous nannofossils[12] or planktonic foraminifera[13]] may reflect sea level changes during periods of glacio-eustasy. Variations in arid vs. wet climates reflected in land-based flora (e.g., palynomorphs) or lacustrine fauna (e.g., ostracods) help identify climatic changes that control the development of stratigraphic sequences.
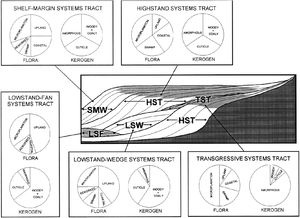
Figure 3 illustrates the utility of variations in palynological assemblages, reflecting differing paleoenvironmental settings, when differentiating and identifying systems tracts.
Maximum flooding surfaces and condensed sections[edit]

The maximum flooding surface (which may in fact be a thin stratigraphic interval) marks the turn-around point from an overall deepening to an overall shallowing trend. Associated with this horizon may be a major condensed section, marked by the lowest terrigenous input, the greatest water depth (approximately), and organic enrichment. This condensed section can provide important fossil age data on continental margins[14] because it usually contains the greatest abundance of microfossils and the highest concentration of pelagic forms, such as planktonic foraminifera and calcareous nannofossils. Other condensed sections are also (but less commonly) found (1) at the top of depositional cycles within the lowstand wedge and (2) overlying individual lowstand fans.
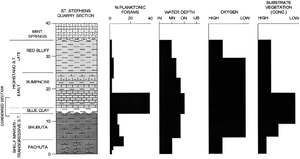
Figure 4 illustrates paleontologic and paleoenvironmental variables across a condensed section in the upper Eocene at St. Stephens Quarry, Alabama. The condensed section corresponds to the unnamed blue clay. Overlying Eocene Red Bluff and Bumpnose Formations are highstand systems tract deposits; the Pachuta and Shubuta Formations represent shelf margin and transgressive systems tracts.
See also[edit]
- Applications of biostratigraphy
- Biostratigraphic correlation and age determination
- Paleoenvironmental analysis
- Paleobathymetry
- Quantitative paleoenvironmental analysis
- Palynofacies and kerogen analysis
- Thermal maturation
References[edit]
- ↑ 1.0 1.1 Van Wagoner, J. C., R. M. Mitchum, K. M. Campion, and V. D. Rahmanian., 1990, Siliciclastic sequence stratigraphy in well logs, cores, and outcrops: AAPG Methods in Exploration 7, 55 p.
- ↑ Baum, G. R., and P. R. Vail, 1987, Sequence stratigraphy, allostratigraphy, isotope stratigraphy, and biostratigraphy: putting it all together in the Atlantic and Gulf Paleogene, in Innovative Biostratigraphic Approaches to Sequence Analysis: New Exploration Opportunities: Selected Papers and Illustrated Abstracts of the Eighth Annual Research conference of the Gulf Coast Section of the Society of Economic Paleontologists and Mineralogists Foundation, p. 15–23.
- ↑ Arthur, M. A., and W. E. Dean, 1986, Cretaceous paleoceanography, in B. E. Tucholke, and P. R. Vogt, eds., Decade of North American Geology, Western North Atlantic Basin Synthesis Volume: Geological Society of America, p. 617–630.
- ↑ 4.0 4.1 Haq, B. U., J. Hardenbol, P. R. Vail, 1988, Mesozoic and Cenozoic chronostratigraphy and cycles of sea-level change, in C. K. Wilgus, B. S. Hastings, C. G. St. C. Kendall, H. W. Posamentier, C. A. Ross, and J. C. Van Wagoner, eds., Sea-level Change: An Integrated Approach: SEPM Special Publication 42, p. 71–108.
- ↑ 5.0 5.1 Simo, J. A. T., R. W. Scott, and J.-P. Masse, 1993, Cretaceous carbonate platforms: an overview, in J. A. T. Simo, R. W. Scott, and J.-P. Masse, eds., Cretaceous Carbonate Platforms: AAPG Memoir 56, p. 1–14.
- ↑ Harland, W. B., R. L. Armstrong, A. V. Cox, L. E. Craig, A. G. Smith, and D. G. Smith, 1990, A Geologic Time Scale—Revised Edition: Cambridge, Cambridge University Press, 263 p.
- ↑ Berggren, W. A., D. V. Kent, C. Swisher, and M.-P. Aubry, 1995, A revised Cenozoic geochronology and chronostratigraphy, in W. A. Berggren, D. V. Kent, M.-P. Aubry, and J. Hardenbol, eds., Geochronology, Time Scales, and Global Stratigraphic Correlation: Society for Sedimentary Geology (SEPM) Special Publication 54, p. 127–208.
- ↑ Gradstein, F. M., F. P. Agterberg, J. G. Ogg, J. Hardenbol, P. Van Veen, J. Thierry,and Z. Huang, 1995, A Triassic, Jurassic, and Cretaceous time scale, in W. A. Berggren, D. V. Kent, M.-P. Aubry, and J. Hardenbol, eds., Geochronology, Time Scales, and Global Stratigraphic Correlation: Society for Sedimentary Geology (SEPM) Special Publication 54, p. 93–125.
- ↑ Fisher, W. L., and J. H. McGowen, 1967, Depositional systems in the Wilcox Group of Texas and their relationship to occurrence of oil and gas: Transactions of the Gulf Coast Association of Geological Societies, vol. 17, p. 105–125.
- ↑ Brown, L. F., and W. L. Fisher, 1977, Seismic–stratigraphic interpretation of depositional systems: examples from Brazil rift and pull-apart basins, in C. E. Payton, ed., Seismic Stratigraphy—Applications to Hydrocarbon Exploration: AAPG Memoir 26, p. 213–248.
- ↑ Armentrout, J. M., 1987, Integration of biostratigraphy and seismic stratigraphy: Pliocene–Pleistocene, Gulf of Mexico, in Innovative Biostratigraphic Approaches to Sequence Analysis: New Exploration Opportunities: Selected Papers and Illustrated Abstracts of the Eighth Annual Research conference of the Gulf Coast Section of the Society of Economic Paleontologists and Mineralogists Foundation, p. 6–14.
- ↑ Shaffer, B. L., 1987, The potential of calcareous nannofossils for recognizing Plio–Pleistocene climatic cycles and sequence boundaries on the shelf, in Innovative Biostratigraphic Approaches To Sequence Analysis: New Exploration Opportunities: Selected Papers and Illustrated Abstracts of the Eighth Annual Research conference of the Gulf Coast Section of the Society of Economic Paleontologists and Mineralogists Foundation, p. 142–145.
- ↑ Martin, R. E., E. D. Neff, G. W. Johnson, and D. E. Krantz, 1993, Biostratigraphic expression of Pleistocene sequence boundaries, Gulf of Mexico: Palaios, vol. 8, no. 2, p. 155–171., 10., 2307/3515169
- ↑ 14.0 14.1 Loutit, T. S., J. Hardenbol, P. R. Vail, and G. R. Baum, 1988, Condensed sections: the key to age determination and correlation of continental margin sequences, in C. K. Wilgus, B. S. Hastings, C., G. St. C. Kendall, H. W. Posamentier, C. A. Ross,and J. C. Van Wagoner, eds., Sea-Level Changes: An Integrated Approach: SEPM Special Publication 42, p. 183–213.
