Capillary pressure (Pc) curves: pore throat size determination
| Exploring for Oil and Gas Traps | |

| |
| Series | Treatise in Petroleum Geology |
|---|---|
| Part | Predicting the occurrence of oil and gas traps |
| Chapter | Predicting reservoir system quality and performance |
| Author | Dan J. Hartmann, Edward A. Beaumont |
| Link | Web page |
| Store | AAPG Store |
Capillary pressure (Pc) curves are a rock property measurement that relates the volume of pore space controlled by pore throats of a given size (usually given in microns) to a given capillary pressure.
What is capillary pressure?
Pc is the resistant force to hydrocarbon migration. It is a function of the interfacial tension (γ), the wettability (Θ), and pore throat radius (r). Pc increases with decreasing pore throat size, increasing interfacial tension, and increasing contact angle (greater oil wetting). It can be expressed as follows:
This expression assumes the capillary phenomenon occurs within a tube with a circular cross section. Real pores only approximate this, and then only if they are intergranular or inter crystalline.[1]
Capillary test procedure
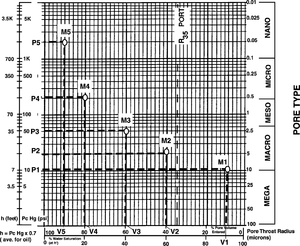
In a mercury capillary pressure test, a rock with a measured porosity is immersed in a mercury pressure cell. The pressure in the cell is raised to a predetermined pressure level (P1, Figure 1). When the cell comes to equilibrium, the volume of injected mercury is measured (V2). Since the porosity of the test sample is known prior to the test, the volume of injected mercury can be converted to the percent of the total pore volume filled with mercury (for example, 10% at pressure::10 psi for point M1). All the pores filled with mercury at this point in the test have at least one 10μ pore throat radius or larger and represent 10% of the sample's pore volume. This procedure is repeated several more times at different pressures (for example, points M2 through M5).
Pore throat profiles
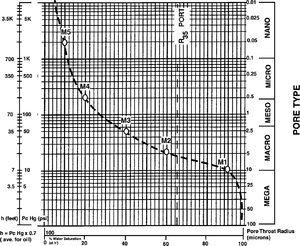
A curve is drawn through the measured points at test completion. This capillary pressure curve also represents a pore throat size profile for the tested sample. It relates a given pore throat size to its capillary resistance (Pc). Figure 2 shows the curve drawn through the points in Figure 1.
Converting capillary pressure to pore throat size
Capillary pressure curves are converted to profiles of pore throat size by solving the previous equation for r:
Capillary pressure for a given Sw can also be converted to an approximation of height above free water (h) within a reservoir system. From a capillary pressure curve at a given Sw, we read the capillary pressure and multiply it by a factor that converts Pc to buoyancy pressure (Pb). If the conversion factor is not known, we use 0.4 for gas and 0.7 for oil.
Using pc to estimate h and r
Use the table below to estimate height above free water (h) and pore throat radius (r) from a mercury capillary pressure curve.
| To estimate | Follow this procedure |
|---|---|
| Pore throat size ( r ) from Sw |
|
| Height above free water level (h) from Sw |
|
Example
Using the curve in Figure 3, if Sw = 20% (point 1), then the mercury capillary pressure (Pc) that must be overcome to enter pore throats at that point on the curve is pressure::200 psi (point 2). Converting mercury Pc to hydrocarbon column height (h):
The minimum pore throat radius entered when Sw is 20% and Pc is pressure::200 psi is 0.5μ.
See also
- Pore systems
- Pore system fundamentals
- Pore system shapes
- Pore and pore throat sizes
- Pore throat size and connectivity
References
- ↑ Coalson, personal communication, 1997


