Checkshots and vertical seismic profiles
| Development Geology Reference Manual | |

| |
| Series | Methods in Exploration |
|---|---|
| Part | Geophysical methods |
| Chapter | Checkshots and vertical seismic profiles |
| Author | B. A. Hardage |
| Link | Web page |
| Store | AAPG Store |
Checkshot surveys
Surface-recorded seismic data often comprise the largest database that must be dealt with in reservoir development. However, seismic data have one shortcoming that can limit their usefulness—the reflection events used to map the seismic sequences and the seismic facies that describe the areal and vertical distributions of reservoir and sealing units are measured as functions of seismic traveltime, not as functions of depth. To understand reservoir performance, the boundaries of these units need to be mapped in depth. Thus, the concept of the velocity checkshot survey has been developed to establish time-depth calibration functions at control wells so that surface-recorded seismic images can be reliably converted to the depth images that are needed to do reservoir volumetric calculations.
Checkshot source-receiver geometry
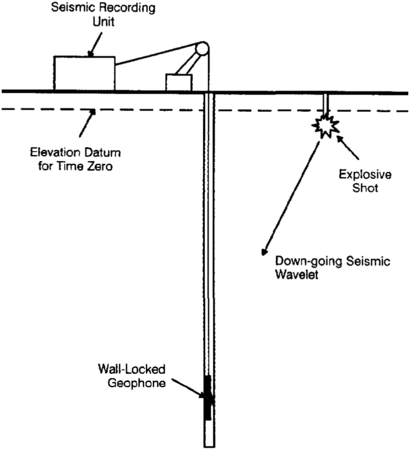
Figure 1 The source-receiver geometry commonly used in onshore checkshot surveys.
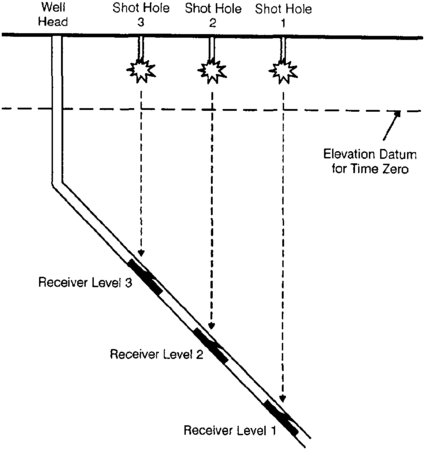
Figure 2 The source-receiver geometry commonly used to record checkshots in deviated wells.
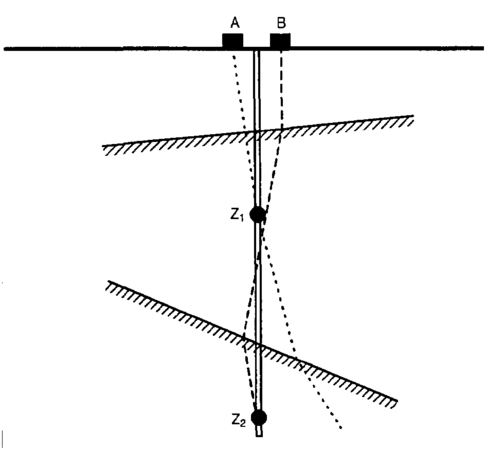
Figure 3 The source position (A or B) should be chosen so that the travel path to each receiver is as nearly vertical as possible.


The purpose of a velocity survey is to produce a down-going seismic wavelet at the surface near a well and then to measure the time required for that wavelet to travel to a known depth where a seismic receiver is positioned in the well. This borehole receiver is locked successively at several different depth levels, and the vertical traveltime to each level is measured.[1] Each measurement of the source-receiver traveltime is a checkshot, and the compilation of all of the traveltime measurements into a time-depth calibration function is referred to as a checkshot survey.
The source—receiver geometry used in onshore velocity checkshots is shown in Figure 1. If possible, the energy source should be the same as that used to record the surface seismic data near the well. A buried explosive charge is shown in this diagram, but other common onshore energy sources include Vibroseis or air guns operated in a water-filled pit near a well. Offshore, essentially all checkshot surveys involve air guns as the seismic energy source.
Ordinarily, the borehole receiver is first lowered to the deepest checkshot level, and the traveltime to this deepest receiver position is measured for one or more surface shots. The receiver is then moved upward a distance of 200, 500, or depth::1000 ft (61, 152, or 305 m) to record the checkshot, or vertical traveltime, at successively shallower levels.
The time-depth calibration function and velocity analyses that can be calculated from checkshot measurements are more reliable if each source-receiver travel path is a vertical straight line rather than an oblique, refracted path.[2] Consequently, if a well is deviated, then the surface position of the source should be readjusted each time the downhole receiver is moved to a new depth level, as shown in Figure 2, so that the travel path always remains as vertical as possible.
Offshore, the vertical traveltime to a receiver is defined relative to sea level. Since the energy source is below sea level when it produces the down-going wavelet, an amount of time equal to the air gun depth divided by the sound velocity in water is added to the measured time to adjust it to a sea level origin.
Onshore, an arbitrary depth coordinate is chosen as the time datum. In Figure 1, the datum is above the shot depth, and in such a case, the vertical distance between the shot depth and the datum depth is divided by the velocity in that interval. That time adjustment is then added to the measured traveltime to each receiver. If the depth datum is below the shot depth, as in Figure 2, this adjustment time is subtracted from the measured traveltime.
When a checkshot survey well penetrates formations that exhibit complicated structural dips, it is advisable to position an energy source on both the updip and downdip sides of the well so that two different traveltime measurements are acquired at each receiver depth. One of the travel paths is usually a better approximation of a straight line than the other. For example, in Figure 3, source position A is preferred when the receiver is at depth Z1 but source position B is the better choice for a receiver at depth Z2. Usually, the traveltimes measured for sources A and B are simply averaged at each receiver depth because the structural dips and formation velocities are rarely known with enough precision to predetermine which travel path is the better approximation of a straight line.
In surveys where the structure is simple horizontal layering but where significant lateral velocity variation occurs, it is also advisable to record traveltimes from shots on opposite sides of the well and average the times so that the checkshot values are not biased with a velocity that is unrepresentative of the prospect area.
When there is sufficient velocity and dip information and adequate presurvey preparation time to allow ray trace modeling of the source—receiver travel path, it is helpful to calculate and display the anticipated ray paths for several possible source and receiver locations to determine which source position produces the best approximation of a straight line travel path to each desired receiver location.
Vertical seismic profiles
A vertical seismic profile (VSP) is recorded in essentially the same way as a checkshot survey.[3] [4] The major difference between a VSP and a checkshot survey is that VSP data are recorded at much smaller spatial sampling intervals than checkshots. While a receiver may be moved a vertical distance of 200 to depth::1000 ft (61 to 305 m) between checkshot levels, it should be moved no more than 50 to length::100 ft (15 to 30 m) when recording a VSP. Specifically, the vertical distance between successive VSP traces should not exceed one-half of λmin, where λmin is the shortest wavelength contained in the recorded VSP wavefield.
When a seismic wave field is recorded with this small spatial sampling interval, several processing techniques can be used to separate the down-going and up-going wave fields. Once the up-going wave field is isolated from the more dominant down-going wave field, the up-going reflection events can be properly analyzed and interpreted and used to produce improved imagery of the subsurface.
VSP source-receiver geometries

Several types of VSPs can be recorded by altering the position of the energy source relative to the receiver. The term offset is used to describe the horizontal distance between the source and receiver. If the receiver is directly below the source, the recorded data are called a zero offset VSP. If there is a significant horizontal distance between the source and receiver, the recorded data are referred to as an offset VSP. Examples of offset and zero offset geometries are shown in Figure 4. A common misuse of the term offset is in describing the horizontal position of the energy source relative to the wellhead rather than the position of the source relative to the location of the subsurface receiver. For this reason, the geometry in Figure 4(d) is an offset VSP, not a zero offset VSP.
In a flat-layered earth, the reflection points associated with a zero offset VSP occur close to the vertical line passing through the source and receiver coordinates. Thus, the image made from these data will illuminate the subsurface in only a narrow vertical corridor passing through the receiver location. However, if there is structural dip, the reflection points associated with a zero offset VSP can occur at significant horizontal distances from the vertical line passing through the source and receiver. When properly processed, such data can produce high resolution images extending from the receiver position to the farthest reflection point coordinate.
For offset VSPs, reflection points are always distributed over some horizontal distance, so offset VSP recording geomety is often used to produce seismic images that traverse portions of a reservoir near survey wells.
See also
- Introduction to geophysical methods
- Seismic interpretation
- Cross-borehole tomography in development geology
- Synthetic seismogram
- Vertical and lateral seismic resolution and attenuation
- Forward modeling of seismic data
References
- ↑ Anstey, N. A., and R. L. Geyer, 1987, Borehole velocity measurements and the synthetic seismogram: Boston, MA, IHRDC, 355 p.
- ↑ Goetz, J. F., L. Dupal, and J. Bowles, 1979, An investigation into discrepancies between sonic log and seismic check-shot velocities: Australian Exploration Association Journal, v. 19, pt. 1, p. 131–141.
- ↑ Balch, A. H., and M. W. Lee, eds., 1984, Vertical seismic profiling—technique, applications, and case histories: Boston, MA, IHRDC, 488 p.
- ↑ Hardage, B. A., 1985, Vertical seismic profiling, Part A— principles, 2nd ed.: Oxford, U., K., Pergamon Press, 509 p.
External links
| find literature about Checkshots and vertical seismic profiles |