Cross-borehole tomography
Cross-borehole tomography can be thought of as an extension of sonic logging to the reservoir cross section between two boreholes. The information obtained from cross-borehole tomography, when properly interpreted in the context of all available information, can often be invaluable for preparing accurate geological cross sections for reservoir development and planning.
Important differences exist, however, between cross-borehole seismic velocity images and sonic logs. Sonic logs usually measure velocity of sound in rocks at very high frequencies (5 to 40 kHz), whereas seismic tomography measures the velocity of sound at seismic frequencies, usually in the frequency range of 20 Hz to as high as several kilohertz. Sonic logs represent the measurement of velocities at the wellbore and are usually plotted as a continuous curve in depth. Because seismic tomography measures the two-dimensional velocity field between the wellbores, it is usually represented by a color-coded map in which a color is assigned to the seismic velocity at each point. This map, or plot, is referred to as a tomogram. Other displays such as contour plots can also be used, but this is not common.
Tomographic data acquisition
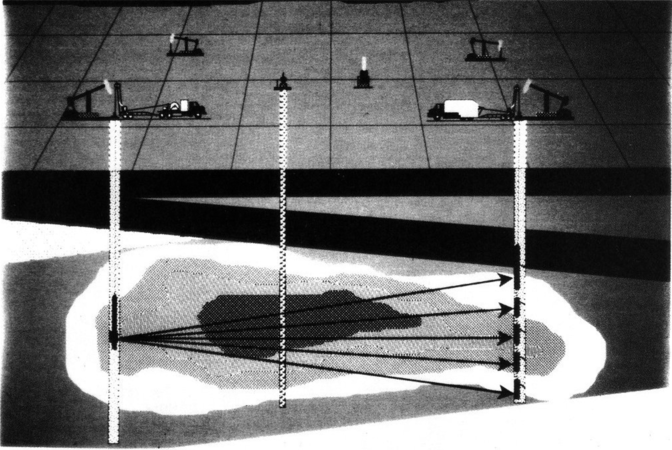
Figure 1 Schematic illustration of tomographic data acquisition.
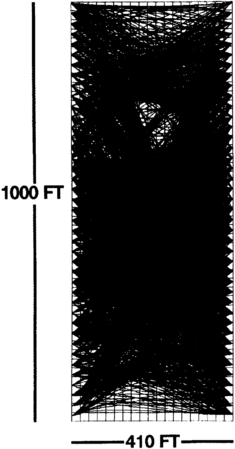
Figure 2 Ray path diagram documenting the distribution of ray paths across a thermal EOR project tomogram.


To acquire seismic tomography data, a source of seismic energy is lowered to the survey depth in the source borehole, and receivers are lowered to an appropriate depth in one or more boreholes that are used to record the seismic data (Figure 1). The source and receivers each occupy a number of stations, usually regularly spaced over a depth range that includes the zone of interest in the reservoir. The spacing of these stations and the vertical interval they cover (aperture) play a role in determining the final spatial resolution of the tomogram. With receivers operating in additional wells, data for several tomograms can be acquired simultaneously.
With source and receivers in place, the source is fired and a recording is made. In traveltime tomography, this recording is later used to compute the time required for the seismic energy to travel from source to receiver. Data are acquired for every combination of source and receiver stations. Ray paths connecting sources and receivers for a typical survey are shown in Figure 2. These traveltime data are then used to infer the seismic velocity field between the wellbores. If attenuation measurements can be made on the data, then the seismic Q-factor can also be imaged in the reservoir. Since the number of source/receiver pairs is usually in the thousands, data acquisition can be a slow process. Wirelines with multiple receivers appropriately placed can reduce the survey time.
Because usable seismic frequencies are an important factor in resolution, sources with the widest possible bandwidth are desirable, and data sampling rates of the recording instruments must be correspondingly high (usually on the order of 10,000 samples per second for each channel). Usually multicomponent receivers, which record data using three orthogonally mounted geophones, are used, so that both shear and compressional waves can be identified. If it is possible to reconstruct both compressional and shear wave tomograms, then Vp/Vs and Poisson's ratio can be computed in the interwell volume.
Borehole source technology
Seismic borehole source technology is receiving considerable attention, and a number of sources are in use or under development to meet the various requirements of power, bandwidth, repeatability, short cycle time (between shots), depth, and temperature, to name a few. It is likely that no single source can meet all requirements, and the source chosen is the one most suitable to the survey conditions (see “Seismic Data Acquisition on Land”). Examples of source technology under development or in use today include
- Sparkers (electrical)
- Air gun (compressed air)
- Piezoelectric (pulsed or swept frequency)
- Hydraulic (vibratory)
- Pneumatic (vibratory)
- Chemical explosive
- Magnetostrictive (pulsed or swept frequency)
Vibratory sources typically generate a swept frequency signal that sweeps across a preset frequency band in a fixed time period (usually on the order of a fraction of a second to several seconds). The swept frequency signal is then correlated with a reference signal to produce a pulselike waveform that is used in processing the data. The advantage of a swept frequency signal is that a high level of energy can be transmitted while keeping the rate of energy input to the borehole within an acceptable range. Higher frequency sources are generally most useful over short interwell distances and/or well consolidated sediments.
Data processing
Cross-borehole tomographic data could be processed using algorithms similar to those used in medical X-ray image reconstruction (CAT scan). However, this is not done because seismic energy does not propagate along a straight line between source and receiver as X-rays do. As a result, special algorithms have been developed for seismic tomography. These algorithms must simultaneously reconstruct both the seismic velocity field of the reservoir as well as the path of the energy through it. Algorithms based on ray tracing or some form of the wave equation are usually used. These algorithms solve a system of thousands of nonlinear equations to reconstruct the velocity field between the boreholes for compressional and/or shear waves.
Survey types
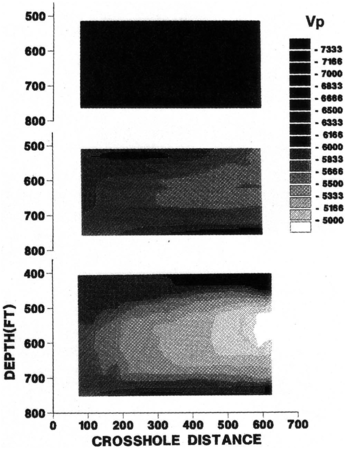
Figure 3 Time lapse tomograms acquired at 6 month intervals across a thermal EOR project. (After Justice et al.[1])
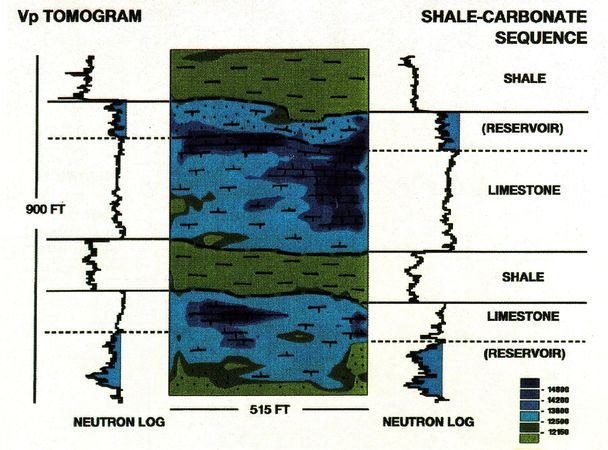
Figure 4 Single image tomograms documenting stratigraphy and reservoir zones. Heterogeneity of the lower reservoir is documented by the contrast in log curves and the corresponding change in the tomographic velocity fields. (After Justice et al.[1])


Two major types of tomographic surveys are in use today. These consist of single tomograms for imaging reservoir characteristics, and time-lapse tomography for imaging time evolution processes in reservoirs such as those associated with enhanced oil recovery (EOR).
In time-lapse tomography, a baseline survey is taken, ideally before an EOR (or similar) project begins. The resulting tomograms may or may not be interpreted at this time. After an appropriate time interval, during which the EOR program is operating and inducing changes in the reservoir, a second survey is taken. The resulting tomograms will be of little additional value unless the changes in the reservoir have also induced changes in the seismic velocity field. Fortunately, there are some well-documented situations in which this does occur.[2][1][3][4] For example, heating of heavy oils by steam injection can produce large reductions in the seismic velocity field in the affected part of the reservoir.
With at least two time-lapse surveys in hand, the differences in the successive images (Figure 3) should relate to changes induced in the reservoir by the process, all other factors being constant.
Single tomographic images, however, are often difficult to interpret. Changes in the observed seismic velocity field across the reservoir may be due to the combined effects of lithology, pore fluids, and the physical state of the reservoir. Often geological stratification is easily discernible (Figure 4) due to the contrast in seismic velocities characteristic of different types of rocks The results of faulting and other structural features in the reservoir can also sometimes be seen, when associated with a sufficient contrast in seismic velocities.
Applications
Numerous applications have been and are being identified for cross-borehole tomography in development geology, including
- Identification of high porosity zones between wells (where porosity is clearly related to seismic velocity)
- Locating well sites for infill drilling
- Monitoring enhanced oil recovery programs
- Structural and stratigraphic mapping of the reservoir and preparation of cross sections
- Monitoring reservoir dynamics such as movement of the gas cap or fluid contacts
- Improved reservoir characterization and modeling
Tomography data analysis

Tomography interpretations need to document reservoir properties and/or the production process in a way that development geoscientists and engineers can steadily understand and use in subsequent production planning. Before interpretation, tomography data quality and potential interpretation pitfalls should be evaluated. Appropriate tomography display parameters also need to be selected. Interpretations, which can then be completed based on correlations with reservoir data and models, should be presented using integrated data displays.
Tomography data quality should be analyzed to identify possible data-dependent limitations on interpretation. Travel time error must be evaluated to estimate velocity uncertainty. Spatial resolution should also be estimated based on shot and receiver intervals. Ray path diagrams should be analyzed to identify zones that may have insufficient coverage.
Numerous interpretation pitfalls, which can make part or all of an interpretation uncertain, are also important to evaluate. Since velocity is affected by many factors, incomplete geological characterizations or log data increase the uncertainty of tomography interpretations. Sufficient well data are therefore necessary to support interpretation adequately. In reservoirs where EOR processes cause rapid changes, correlation of tomograms with older logs may not be valid. Efforts should be made to run logs at the same time the tomography data are acquired.
Tomography display parameters are one of the more important factors governing the ease of interpretation and acceptance of results. To facilitate correlations with cross-borehole geology, tomogram velocity fields should be scaled to match major stratigraphic and reservoir units (Figure 4). The definition of smaller velocity fields may be appropriate to show details such as reservoir heterogeneity within selected major velocity fields. Stratigraphic units such as formation tops and sedimentary facies should also be delineated. In addition to defining velocity fields that match geological units, the use of standard colors and/or graphic symbols for rock units is important. Cold colors (blues) should be used for high velocity fields with a transition to hot colors (reds) for low velocities. Using these guidelines for display should result in tomograms that closely resemble geological cross sections and are more readily understood and utilized by geologists, engineers, and management. Analysis of tomograms with reference to reservoir models and any available surface seismic should provide the basis for interpretations that can be summarized with integrated data displays, as illustrated in Figure 5. Most important are the well data to velocity field correlations and the log to tomography correlations documenting lithology, porosity, fluid saturation, and temperature. The resulting log and tomography display should provide the data needed to qualitatively document cross-borehole structure, especially dip and faults, reservoir heterogeneity and homogeneity, fluid contacts and any EOR flood fronts.
See also
References
- ↑ 1.0 1.1 1.2 1.3 Justice, J. H., A. A. Vassiliou, S. Singh, J. D. Logel, P. A. Hansen, B. R. Hall, P. R., Hurt, and J. J. Solanki, 1989, Acoustic tomography for monitoring enhanced oil recovery: Leading Edge, v. 8, p. 12–19., 10., 1190/1., 1439605
- ↑ Nur, A. M., 1984, Seismic monitoring of thermal enhanced oil processes: Society of Exploration Geophysicists Expanded Abstracts, 54th Annual Meeting, p.337-340.
- ↑ Justice, J. H., A. A. Vassiliou, M. E. Mathisen, S. Singh, P. S. Cunningham, and P. R. Hutt, 1992, Acoustic tomography in reservoir surveillance: Society of Exploration Geophysicists, Reservoir Geophysics, p. 321–334.
- ↑ Justice, J. H., M. E. Mathisen, A. A. Vassiliou, I. Shiao, B. R. Alameddine, and N. J. Guinzy, 1993, Crosswell seismic tomography in improved oil recovery: First Break (in press).
External links
| find literature about Cross-borehole tomography |