Cross section
Geological cross sections are graphical representations of vertical slices through the earth used to clarify or interpret geological relationships with or without accompanying maps. As with other tools applied to petroleum development, cross sections are used to portray geological information in a visual form so that reservoir characteristics can be readily interpreted. For example, a thorough understanding of regional structural and stratigraphic relationships may lead to better characterization of reservoir flow units (see Flow units for reservoir characterization).
There are two major classes of cross sections used in understanding petroleum reservoirs.
- Structural cross sections, which show the present day geometry of an area
- Stratigraphic cross sections, which show prior geometric relationships by adjusting the elevation of geological units to some chosen geological horizon (Figure 1).
A third type of cross section called a balanced cross section is a combination of these two. This type attempts to portray the form of geological units prior to some episode of deformation (see Evaluating structurally complex reservoirs). It can provide important conclusions about present day geometry and past stratigraphic relationships.
Stratigraphic cross sections[edit]

Stratigraphic cross sections show characteristics of correlatable stratigraphic units, such as reservoir sandstones or sealing shales. They may also be vital in understanding the timing of deformation by showing the drape of sediment over developing folds or the thickening of the section across growth faults. The following elements of cross section design are presented as if they were a sequence. In practice, however, each choice affects and is affected by the others.
Choice of datum[edit]
The datum is the level or reference horizon from which elevations and depths are measured in the cross section. In a stratigraphic cross section, the geologist takes advantage of the principle of original horizontality to produce an interpretation of what the chosen slice of the earth might have looked like at some time in the past. By “hanging” all the available vertical information on a stratigraphic horizon or datum that can be correlated along the full length of the cross section, the data are transformed to reflect a different horizontal plane, one that existed at an earlier time (see Figure 1a). The assumption that this surface was horizontal when deposited assumes no original depositional slope.
The purpose of the cross section is to determine which horizon can serve as the datum. Because it is shown as horizontal, the thickness variations of the units directly above and below the datum are most simply interpretable on the cross section. The cross section in Figure 1b uses the horizon labeled F as a datum because this has been interpreted as the top of a chronostratigraphic sequence.[1]
An unconformity is commonly used as a datum. In many circumstances, unconformities represent relatively uniform and geologically important time horizons and are therefore useful features on which to hang cross sections. However, caution must be used since the sedimentary layers may reflect paleotopographic relief.
Orientation and layout of the cross section[edit]

The orientation of a cross section must be chosen to balance the need for a clear representation of the features of interest with the availability of appropriate information. In development geology, this information comes largely from well data (geophysical logs, mudlogs, and cores), but in some places, outcrops and seismic reflection data can be used to constrain interpretations.
Stratigraphic sections should be oriented perpendicular to depositional strike (dip or transverse section) to show facies changes toward or away from the basin margin. Strike sections parallel to the basin margin should be drawn to show lateral variations of particular beds or sequences. In the tectonic context of a basin, these axes are also structural axes. Determining the orientation of a stratigraphic section is also complicated by the fact that stratigraphic trends may be at any angle to subsequent structural trends.
When the main source of data is well logs, it is traditional to lay out cross sections to connect wells, which may result in a zigzag path in map view. The cross section is built simply by connecting selected horizons with straight lines and avoids the errors introduced by inexact projection of the data onto a single plane of section. This type of layout results in a distorted view of structural forms if one also constructs a structural cross section of the same wells, as apparent dips will vary along such a section, making a smooth structure appear irregular in form. In horizons with rapidly varying thicknesses, this approach can also create apparent irregularities in thickness.
For the purpose of stratigraphic correlation and interpretation, the precise rendering of structural form may be of lesser importance. For example, Figure 2 shows a stratigraphic cross section in which horizontal scale is entirely schematic because stratigraphic and well log variations across a number of fault blocks are the main features of interest and the details of lateral variations are of lesser importance. The path of a cross section that has bends in it (Figure 1), whether to accommodate well location or for other reasons, should always be shown on an index map.
The preference for sections that connect well locations may be conditioned by the computational burden of projecting well log data onto a single vertical plane. For stratigraphic cross sections, this approach is generally sufficiently exact even when wells are moderately deviated because the vertical scale is exaggerated and differences from the vertical are minimized (see Figure 1a versus 1b). But the increasing importance of directional drilling means that this approximation is no longer sufficient.
In a substantially deviated well, it is important to correct for the deviation of the wellbore to give a proper representation of the stratigraphic thickness of units. In many areas, this can be accomplished by using a true stratigraphic thickness (TST) log (see Conversion of well log data to subsurface stratigraphic and structural information).
Selection of data[edit]
Once the choices of datum and orientation have been made, the next step is to decide what data must be displayed.
If the object of the cross section is to show lateral and vertical details of the stratigraphy, log properties are of utmost importance.
Typically the SP or gamma ray log and one resistivity log are displayed (Figure 2). Porosity logs may also be important, and if seismic data are part of the cross section, the sonic log is a critical tool to demonstrate the velocity structure, and consistency of conversion of time to depth.
Lines connecting correlative formation or zone tops between wells will show the lateral variation in thickness of these units. If it is important for the display to show exact correlations on logs, these lines should be drawn horizontally across the log display and angled between the edges of adjacent well displays, such as shown in Figure 2. Straight lines connecting the centers of the well displays may be more appropriate to provide a better representation of the thickness variations of units between wells. If thickness variations or the geometry of units is paramount in importance, then the logs can be reduced in scale so as to form a background or overlay to the formation data. Alternatively, they can be omitted entirely, and well courses can be represented as line segments, as shown in Figure 1b.
If lithological data from core and/or cuttings are available, these can be displayed in columnar form between or alongside log tracks and hung on appropriate well log horizons. Other data that may form an important part of the cross section include hydrocarbon shows, productive horizons, and geochemical data (such as vitrinite reflectance). The same procedures can be applied to constructing outcrop cross sections.
Vertical and horizontal scale[edit]
To show significant details of stratigraphic variation, it is usually necessary to exaggerate the vertical scale with respect to the horizontal scale on a stratigraphic cross section. It is important to realize the effect that this distortion has on reservoir geometry and angular relationships of geological surfaces. The small angular differences between stratigraphic horizons that account for thickness variations are strongly exaggerated in such a section. The apparent dip of a bed in a vertically exaggerated cross section is related to true dip by the following equation:[2]

where
- δE = apparent dip in exaggerated section
- δ = true dip
- V = vertical exaggeration, or
- , the ratio of vertical scale (Iv) to horizontal scale (Ih)

As a result of this relationship, low dips are exaggerated and appear larger, whereas higher dips all appear close to vertical. The effect is illustrated in Table 1, where selected values of true and apparent dip are shown for vertical exaggerations of five and ten times. Note that two horizons differing in dip by only 3° appear to differ by 14° and 22°, respectively, for the two values of vertical exaggeration. Any attempt to render structural form on a stratigraphic cross section is schematic but should take into account this effect. It is also important to remember that the image one creates with a stratigraphic cross section is a distortion of reality.
Labeling[edit]
While a working stratigraphic cross section may serve well without a great deal of labeling, any section presented to a wider audience should have at least its location, orientation, scales, and well locations properly indicated.
Structural cross section[edit]
A structural cross section is made to show the shape of a geological structure so as to evaluate the relationship of fluid contacts and compartments to that structure. Such features as spill points, rollover on faults, and fault geometry give an indication of the likely limits of field production. The form of a structure also provides information about its history and thus possibly the history of reservoir formation and oil migration.
Choice of datum[edit]
For a structure cross section, the datum is sea level, with data plotted above or below that point according to its present position (see Figure 1b).
Orientation and layout of a cross section[edit]
Linear cross sections are preferably oriented perpendicular to the major structural trends (dip or transverse sections). Bends in the section can be introduced to accommodate variable structural trends or to show different features. In a straight section, much of the data will usually be projected into the plane of section. Accomplishing this projection requires detailed knowledge of the strike direction. If the structural trend is variable so that the cross section is not everywhere perpendicular to strike, data should be projected along strike onto the section. To fully represent the structure, several transverse sections may be linked by a longitudinal or strike section running parallel to the strike. Strike sections may also be important in showing the plunge of a structure, culminations in a fold, or the importance of secondary structures (for example, normal faults across a fold axis).
Some structures plunge steeply (>30°), producing distortion of the geometry in a vertical cross section, so that it may be preferable to construct a profile section in which the plane of section is perpendicular to the plunge of the structure rather than being vertical. This section will be important for understanding geological history and of less importance for understanding the relationship of fluids in the associated reservoirs. However, one type of nonvertical section may be crucial to understanding the filling of reservoirs. This is the fault plane section,[3] which is constructed from well or seismic data to represent the surface of a fault with the trace of units that intersect the fault on either side.
Selection of data[edit]
For understanding the geometry of structures (folds and faults), an undistorted view of the shapes of geological units is important. Logs can be reduced in size with only the major units represented (Figure la). Where well control is dense and computers are available, it may be best to construct structural cross sections by using gridded and contoured stratigraphic surfaces and drawing each horizon as one would a topographic profile.
If it is important to demonstrate the control of structure on fluid contacts, it may be vital to show the primary log data from which these are interpreted (see Fluid contacts). Other data, such as dips from a dipmeter log, can be schematically represented.
Vertical and horizontal scale[edit]
Structural cross sections should be constructed with no or very little vertical exaggeration so that true dips and geometry of an interval can be depicted. The apparent dip equation given earlier indicates that not only are small dip variations increased, but at high dips, the differences are minimized (see Table 1). For example, a relatively shallow thrust fault at 45° and a steep normal fault at 75° would appear to have dips of 79° and 87°, respectively, in a cross section at five times vertical exaggeration and are thus virtually indistinguishable at first glance. In addition, distortion due to vertical exaggeration may introduce apparent thickness variations between limbs and axial regions of folds.
| Vertical Exaggeration | True Dip | Apparent Dip |
|---|---|---|
| Five times | 1° | 5° |
| 2 | 10 | |
| 5 | 24 | |
| 10 | 41 | |
| 45 | 79 | |
| 75 | 87 | |
| Ten times | 1° | 10° |
| 2 | 19 | |
| 5 | 41 | |
| 10 | 60 | |
| 45 | 84 | |
| 75 | 88 |
Cross sections in three dimensions[edit]

Figure 3 An example of a fence diagram.
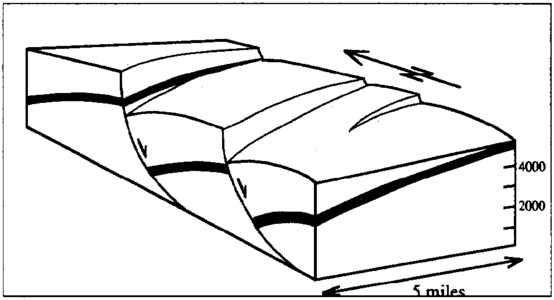
Figure 4 An example of a block diagram.


When the full three-dimensional aspect of a field must be shown, a single cross section or even a suite of cross sections may not be sufficient. The display of numerous wells in a three-dimensional array can be accomplished by a fence diagram, in which the datum horizon is represented by the plane of the map. Well plots are displayed vertically, with the datum at the well location on the map plane (Figure 3). The wells are the “fence posts,” and the lines connecting formation tops are the “rails” that give this diagram its name. Geological relationships can also be portrayed on a block diagram, in which the sides and top of a schematic block cut into the earth at the location of interest are shown in a three-dimensional representation (Figure 4).
Computer generation of cross sections[edit]
Cross sections are now routinely and rapidly constructed by computers. Computers process input data to construct cross sections in two ways, each of which has a pitfall. The more sophisticated method involves the use of program algorithms to interpolate and extrapolate from the limited available data to a complete cross section, such as the connecting of stratigraphic tops with straight lines. This process can go wrong when a well does not have a full set of tops picked such that false correlations are created. Thus, one pitfall to be aware of is the indiscriminate application of software to computer generation of cross sections.
The second way computers function to streamline the preparation of cross sections is to allow the geologist to enter and manipulate one's own interpretations. This capability is especially useful when dealing with discontinuities such as faults that are not handled well by mathematical algorithms. However, a pitfall here is the indiscriminate application of personal interpretation or opinion. If one's interpretation disagrees with that made by the computer, it is important to discover why the two interpretations differ.
Further reading[edit]
Useful links about cross sections and how to construct them.
- Oil on my Shoes
- Reading geologic cross sections and maps
- Example of constructing a cross section and calculating strike and dip in a complex topography (go to chapter 5)
See also[edit]
- Introduction to geological methods
- Subsurface maps
- Evaluating structurally complex reservoirs
- Conversion of well log data to subsurface stratigraphic and structural information
- Evaluating stratigraphically complex fields
- Structural maps and cross sections
- Regional maps and cross sections
References[edit]
- ↑ 1.0 1.1 1.2 Slatt, R. M., S. Phillips, J. M. Boak, and M. B. Lagoe, 1993, Scales of geological heterogeneity of a deep-water sand giant oil field, Long Beach unit, Wilmington field, California, in Rhodes, E. G., Moslow, T. F., eds., Marine Clastic Reservoirs—Examples and Analogs: New York, Springer-Verlag.
- ↑ Langstaff, C. S., and D. Morrill, 1981, Geologic Cross Sections: Boston, MA, IHRDC, 108 p.
- ↑ Allan, V. S., 1989, Model for hydrocarbon migration and entrapment within faulted structures: AAPG Bulletin, v. 73, p. 803–811.
External links[edit]
| find literature about Cross section |