EMD Tight Oil & Gas Committee 2019-20 Annual Report
Committee Members
Chair - Justin Birdwell, Government Representative (through October 2020)
Vice-Chair - Lucy Ko, Academia Representative and Incoming Chair
Vice-Chair - Wayne Camp, Industry Representative (through October 2020)
Incoming Vice-Chair - Allison Gibbs, Industry Representative
Incoming Vice-Chair - Ming Suriamin, Government Representative
Advisory Group Member - Robert J. Coskey, Rose Exploration, Inc.
Advisory Group Member - Ursula Hammes, Hammes Energy & Consultants, Austin, TX
Advisory Group Member - Bruce S. Hart, Freelance Geologist & Adjunct Professor at Western University
Advisory Group Member - Per Kent Pedersen, University of Calgary
Advisory Group Member - Andrew Pepper, This is Petroleum Systems LLC
Advisory Group Member - Keith W. Shanley, Oxy Petroleum
Advisory Group Member - Troy T. Tittlemier, MagmaChem Research Institute
Executive Summary
Contributions by Lucy Ko, Ursula Hammes and Justin Birdwell
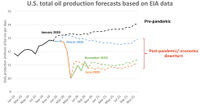
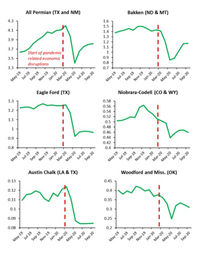
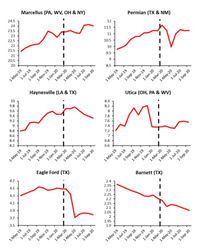
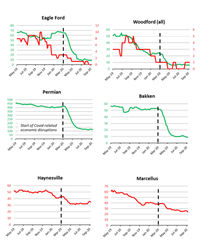
In 2019, total daily tight oil and gas production increased in the United States month over month, with annualized growth of 14% for oil and 12% for gas. Those gains leveled off in the first quarter of 2020 due to aggressive price competition and increases in international production. Then came the pandemic with a substantially larger dose of economic turmoil, driving down demand due in part to shelter in place orders and safety concerns around travel. Between March and May, tight oil and gas production dropped by nearly 2 million bpd and almost 5 Bcf/day before beginning to recover. Production has continued to increase for the most part through the second half of 2020, but drilling remains subdued throughout most of the U.S. and uncertainty around long term demand along with the current price environment and general state of the economy has contributed to layoffs throughout the industry.
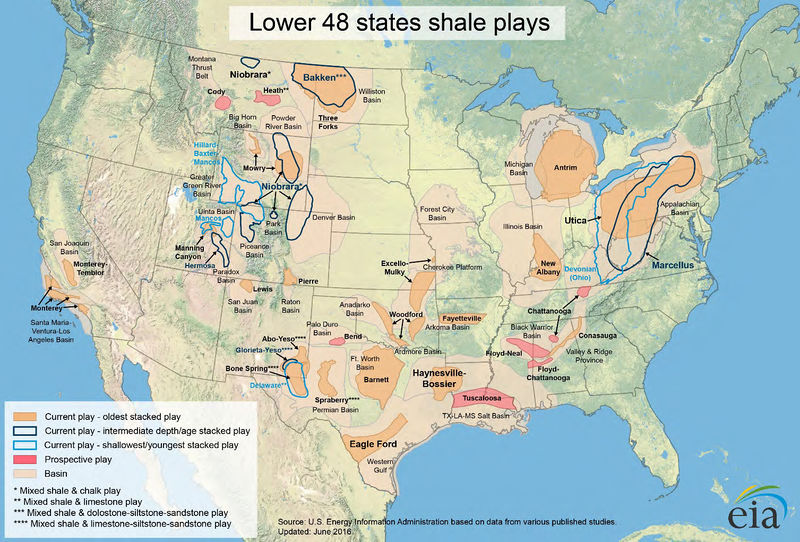
Some shale-gas production has declined recently, but a few areas have seen expansion due to construction of LNG facilities along the East Coast of the U.S. (e.g., the Haynesville Formation). Current U.S. shale-gas production is still higher now than in 2019, with daily production of almost 71 Bcf as of October 2020 driven in large part by increased production from the Marcellus Shale in the Appalachian Basin and shales within the Permian Basin. Shale liquids production is down by around a million bpd to approximately 7.1 million (September 2020; U.S. EIA) from pre-pandemic production levels at the end of 2019 and beginning of 2020. Tight oil production remains dominated by plays in the Permian Basin as well as the Bakken and Eagle Ford Formations.
On the development and production front, new enhanced oil recovery approaches for tight shale reservoirs are being more widely implemented. Natural gas or CO2 injection is currently being utilized in the Bakken Formation, Eagle Ford Formation, Anadarko Basin, and the Permian Basin to optimize injection sequences and boost recovery. Refracturing of existing wells to reduce drilling costs, improve production, and prolong well productive life has also begun to occur more widely in developed plays.
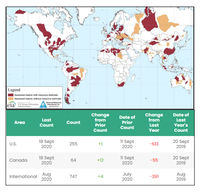
International interest in exploiting hydrocarbons from unconventional reservoirs continues to develop, with active exploration projects on most continents. Europe remains relatively underexplored as compared to North America, although a total of 141 exploration and appraisal wells with a possible shale-gas exploration component have been spudded, including horizontal legs from vertical wells. Shale exploration has made a breakthrough in China with shale gas output in 2019 of 10 billion cubic meters (35.3 Bcf), 60% of which was produced from Sinopec’s Fuling Shale Gas field. Lacustrine shale oil exploration has also been successful in the Sichuan and Ordos Basins in central China, Junggar and Tarim Basins in northwest China, and Songliao Basin in north China, and Bohai Bay Basins in northeast China as of 2018.
South America’s potential as an unconventional shale gas and oil province is mainly in Argentina and Brazil, where the production from Neuquen Basin’s tight shale of the Vaca Muerta Formation has been steadily increasing since 2016, but only 4% of the shale resource has been developed thus far. According to International Energy Agency’s report in 2013, Brazil holds the 9th largest unconventional gas reserves. Brazil has shale oil and gas potential in the Parana, Solimoes and Amazon Basins and is actively producing from the oil shale unit of the Irati Formation. In 2019, the Brazil energy ministry launched REATE 2020 to boost onshore investments that include the expectation of drilling an experimental unconventional well in the northeast region.
For this inaugural report, the new AAPG EMD Tight Oil and Gas Committee (TO&G; formerly the Shale Gas & Liquids and Tight Gas Sands committees) has developed new commodity report requirements for contributors. This includes shorter annual reports focused on new developments, play concepts, along with the typical updates on production and new drilling in the play areas they cover. We are also asking contributors to collect background geologic and production related information into a document that summarizes important features of the plays they cover that will be stored on the TO&G webpage along with our commodity reports. TO&G is currently working to expand the number of contributors to cover more play areas and replace committee and advisory board members that have recently stepped down. Changes to committee leadership occurred in October as recent chairs transition to EMD elected positions.
Summary of Committee News:
- New AAPG Memoir 120 “Mudstone Diagenesis: Research Perspectives for Shale Hydrocarbon Reservoirs, Seals, and Source Rocks” published with chapters from several TO&G contributors and former leaders (Wayne Camp, Kitty Milliken, Joe MacQuaker, Paul Hackley, Neil Fishman)
- New background documents for resources covered in TO&G annual commodity reports
- Website updates submitted – new resources and links, updates coming more regularly
- Recruiting new contributors to cover more U.S. and international resource plays
- New committee leadership (Lucy Ko –chair starting Oct. 2020, with Vice-Chairs Allison Gibbs and Ming Suriamin)
The following shale system sub-reports are listed and linked respectively below:
U.S. Domestic Reports
- Austin Chalk, Tokio, and Eutaw Formations, U.S. Onshore Gulf Coast (USGS)
- Bakken and Three Forks Formations, Williston Basin, North Dakota and Montana (USGS)
- Barnett Shale (Mississippian), Fort Worth Basin, Texas
- Eagle Ford Group in southwest Texas (USGS)
- Update for Fayetteville Shale Gas Play in Arkansas, 2019
- Haynesville and Bossier Shales (Upper Jurassic), East Texas and Northwest Louisiana, USA
- Marcellus Shale (Devonian) -- Appalachian Basin, U.S.A.
- Mowry Shale, Powder River Basin, WY
- Niobrara & Codell of the Denver-Julesburg Basin
- Potential Self-Sourced Accumulations, North Slope, Alaska (USGS)
- Oklahoma Shale Gas/Tight Oil Plays, U.S.A. (repeat from 2018)
- Permian Basin Shales (USGS)
- Tuscaloosa Marine Shale, Gulf Coast Basin, Louisiana and Mississippi (USGS)
- Tight-Oil Plays and Activities in Utah (repeat from 2018)
- Utica Shale in Ohio, Pennsylvania, West Virginia and Kentucky
International Reports
See also
- Energy Minerals Division
- EMD Bitumen/Heavy Oil Committee
- EMD Coal Committee
- EMD Coalbed Methane Committee
- EMD Critical Minerals Committee
- EMD Energy Economics & Technology Committee
- EMD Gas Hydrates Committee
- EMD Geothermal Energy Committee
- EMD Uranium Committee
- EMD Tight Oil & Gas Committee
- EMD Tight Oil & Gas Committee Annual Reports
- EMD Tight Oil & Gas Committee 2018-19 Annual Report
- EMD Tight Oil & Gas Committee 2020-21 Annual Report
