Eagle Ford Group in southwest Texas (USGS)
By Justin E. Birdwell, U.S. Geological Survey, Denver, CO

Background[edit]
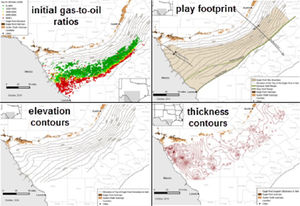
The Eagle Ford Group (or Shale) is a major oil, natural gas, and condensate/natural gas liquids play in southwest to central Texas, extending from the Maverick Basin northeast to the Karnes Trough, with some development extending to and just beyond the San Marcos Arch. The area included in the Eagle Ford is approximately 50 mi wide and 400 mi long with thicknesses varying from less than 100 ft, to more than 600 ft thick in areas including the Maverick Basin, north of the Giddings Field, and near Dallas. The Eagle Ford Group is typically divided into upper and lower strata with the primary target being the mainly Cenomanian, organic-rich, calcareous lower Eagle Ford. The Turonian upper Eagle Ford also contains source potential. It is calcareous in much of the play area, but contains more siliciclastic material moving southwest to northeast.
The organic matter content and quality in the Eagle Ford varies stratigraphically primarily due to variability in the depositional environment. Geographic variation may have been affected by localized depositional conditions and detrital inputs. Kerogen is mainly represented by oil-prone Type II and Type II-S (French et al.[4], and references therein). Production trends in the Eagle Ford correspond to geologic structure. Production distributions from wells are related to depth, which range from ~4000 to more than 14,000 ft deep in a trend north to south across the play (Figure 1). Eagle Ford oil is also widely produced in Texas and parts of Louisiana from wells in the overlying Austin Chalk.

The viability of the Eagle Ford play is dependent on the application of horizontal drilling (laterals average ~6500 ft but extend to ~11,000 ft) and hydraulic fracturing using slick water and acid treatments in multiple fracturing stages. The mineralogy of the Eagle Ford facilitates this development approach, as the high carbonate content of marlstone, limestone, and other mudstones (as much as 70%) make these strata brittle and amenable to fracture propagation. Completed wells show average initial production rates (first full month) of ~600 bbls/day for oil and 2000 Mcf/day for gas, followed by steady production declines with increasing time online. Estimated ultimate recoveries are around 150,000 bbl per well for oil and between 500 and 1500 MMcf per well for natural gas. Initial production rates have increased over the last decade with improvements in production technology, but decline rates for production are also steeper. In the last few years improvements in ultimate recovery have been realized through well re-stimulation or the application of secondary recovery techniques (e.g., huff-and-puff).
The U.S. Geological Survey assessment in 2018 estimated mean undiscovered, technically recoverable resources of 8.5 billion barrels of oil and 66 trillion cubic feet of natural gas in continuous (unconventional) reservoirs in the Eagle Ford and associated Cenomanian-Turonian strata in east Texas and southern Louisiana distributed among seven assessment units (Whidden et al.[6]). The Eagle Ford is somewhat unique among U.S. shale plays in that production data show and assessed resources further indicate it is prolific for both oil and gas, with assessed oil resources comparable to the Bakken Formation in the Williston Basin and natural gas resources essentially equivalent to the Mancos Shale in the Piceance Basin. Condensate is also an important product in the Eagle Ford, with annualized daily production rates averaging over 250,000 barrels per day over the last five years (Texas Railroad Commission[7]).
Production Updates[edit]
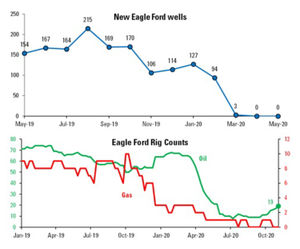
New wells and rig counts in the Eagle Ford play during 2019 showed a general but slight decline with some fluctuations for both oil and gas wells (Figure 2). In late 2019 and early 2020, there was a slight uptick in drilling that subsequently decreased precipitously, first due to the so-called Russian-Saudi price war that led to oil price reductions and second was exacerbated in the spring as the COVID-19 pandemic caused substantial drop in demand. More than 2000 permits were issued in 2019, and nearly all permitted wells were drilled (Texas Railroad Commission[7]; IHS Markit[2]).
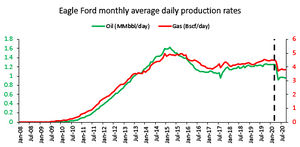
Daily oil production fluctuated around 1.2 million bpd through 2019, peaking at 1.27 million bpd in October, dropping slightly after that through the end of the year (Figure 3). Gas production averaged 4.36 billion scf/day in 2019. Slight drops in oil and gas production occurred in the first three months of 2020, and with the onset of the pandemic production decreased substantially from March to May (27% for oil, 17% for gas) recovering slightly after.
Eagle Ford Water Assessment[edit]
In 2019, the U.S. Geological Survey completed an assessment of water and proppant use and produced waters volumes needed to develop the undiscovered, technically recoverable oil and gas resources associated with the Eagle Ford Group assessed in 2018 (Gianoutsos et al., 2020). This is only the second application of the USGS produced waters assessment methodology (Haines[8]), which is meant to provide an estimate of the volume of water needed to drill wells and amount of hydraulic fracturing fluids (water and proppant) required to recover the oil and gas resources assessed in the most recent USGS Eagle Ford oil and gas assessment[6]. Total produced waters from the formation are also estimated. Flowback water was not assessed due to insufficient data availability.
For the four assessment units considered, the mean estimated total volume of water that would be required for drilling, cementing, and hydraulic fracturing the wells needed to access the mean USGS assessed oil and gas resource estimates is 687.6 billion gallons and the mean estimated quantity of proppant is 420 million tons. The mean total volume of formation water estimated to be produced in extracting the assessed petroleum resources is 177 billion gallons.
Other Research[edit]
According to Scopus, in 2019 there were 59 articles, conference papers, or book chapters that referenced the “Eagle Ford” in their title, and in 2020 the number of new articles was 54 as of November 11. Google Scholar had nearly 4000 hits for mentions of “Eagle Ford” anywhere in an article for 2019 through November 11 (this likely includes many cited references), with more than 150 publications including “Eagle Ford” in the title. AAPG Datapages Archive shows 46 articles with “Eagle Ford” in the title between 2019 and 2021, many of which were proceedings papers on engineering aspects of enhanced recovery presented at the 2019 and 2020 Unconventional Resources and Technology Conferences. Notable publications from the USGS include several on Eagle Ford source rock geochemistry and thermal maturity trends[4]; [9]; [10] and produced waters chemistry[11].
References[edit]
- ↑ U.S. Energy Information Administration, 2015, EIA updates Eagle Ford maps to provide greater geologic detail: accessed May 28, 2020, https://www.eia.gov/todayinenergy/detail.php?id=19651.
- ↑ 2.0 2.1 IHS Markit, 2020. Enerdeq™ U.S. well history and production database: Englewood, Colo., IHS Markit, accessed May 28, 2020, http://www.ihsenergy.com. Cite error: Invalid
<ref>tag; name "IHS" defined multiple times with different content - ↑ Baker Hughes, 2020, North America Rig Count, accessed November 11, 2020, https://rigcount.bakerhughes.com/na-rig-count.
- ↑ 4.0 4.1 French, K. L., J. E. Birdwell, and M. D. Lewan, 2020, Trends in thermal maturity indicators for the organic sulfur-rich Eagle Ford Shale: Marine and Petroleum Geology, Paper no. 104459.
- ↑ U.S. Energy Information Administration, 2020, Petroleum & Other Liquids – Crude oil reserves and production, Tight oil production estimates by play (November 2020), accessed November 11, 2020, https://www.eia.gov/petroleum/data.php#crude.
- ↑ 7.0 7.1 Texas Railroad Commission, 2020, Eagle Ford Shale Information, accessed November 11, 2020, https://www.rrc.state.tx.us/oil-gas/major-oil-and-gas-formations/eagle-ford-shale-information/.
- ↑ Haines, S. S., 2015, Methodology for assessing quantities of water and proppant injection, and water production associated with development of continuous petroleum accumulations: U.S. Geological Survey Open-File Report 2015–1117, 18 p., http://dx.doi.org/10.3133/ofr20151117.
- ↑ Jubb, A. M., J. E. Birdwell, P. C. Hackley, J. J. Hatcherian, and J. Qu, 2020a, Nanoscale Molecular Composition of Solid Bitumen from the Eagle Ford Group Across a Natural Thermal Maturity Gradient: Energy & Fuels, Vol. 34, p. 8167-8177.
- ↑ Jubb, A.M., Hackley, P.C., Birdwell, J.E., Hatcherian, J.J., Jing Q., 2020b, Examination of inertinite within immature Eagle Ford Shale at the nanometer-scale using atomic force microscopy-based infrared spectroscopy: International Journal of Coal Geology, Vol. 231, article no. 103608.
- ↑ Engle, M. A., C. A. Doolan, J. A. Pitman, M. S. Varonka, J. Chenault, W. H. Orem, P. B. McMahon, A. M. and Jubb, 2020, Origin and geochemistry of formation waters from the lower Eagle Ford Group, Gulf Coast Basin, south central Texas: Chemical Geology, v. 550, paper no. 119754.
