Mudlogging: gas extraction and monitoring
| Development Geology Reference Manual | |
| |
| Series | Methods in Exploration |
|---|---|
| Part | Wellsite methods |
| Chapter | Mudlogging: gas extraction and monitoring |
| Author | Alun Whittaker |
| Link | Web page |
| Store | AAPG Store |
The monitoring of gas—both types and amount—is one of the most critical jobs is mudlogging. Early detection of a gas influx will give rig crews time to respond to toxic gases or a potential blowout condition. Accurate gas data recorded during drilling is of great value in proper reservoir evaluation and may even pinpoint potentially overlooked producing zones.
Gas extraction methods
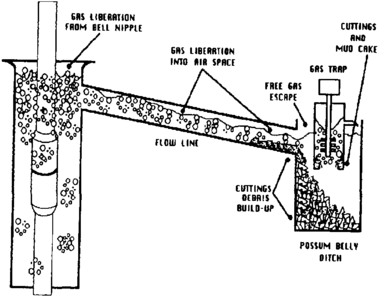
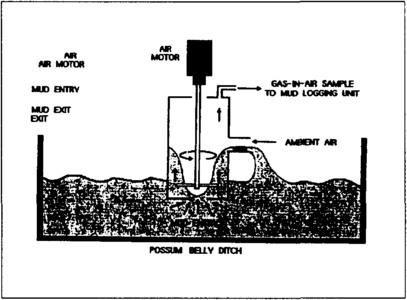
Samples of gas must generally be extracted from the drilling mud by the gas trap. The gas trap is a metal box immersed in the shale shaker possum belly, preferably in a location of maximum mudflow rate (Figure 1). Ports in the lower part of the trap allow mud to enter and leave the trap. An agitator provides both pumping and degassing of mud passing through the trap. Gas evolved from the mud is mixed with ambient air in the upper part of the trap and is then drawn through a vacuum line to the logging unit for analysis (Figure 2).
Inside the logging unit, the gas-air mixture is drawn through a sample chamber containing a heated platinum filament forming one arm of a Wheatstone bridge circuit. Catalytic combustion of hydrocarbon gases at the filament (the so-called hot wire) further heats the filament, causing an increase in its electrical resistance. This change in resistance unbalances the bridge, causing an electrical current to flow in proportion to the resistance change and a resulting concentration of gas. The current is displayed by deflection on a milliammeter or may be used to scale the meter or recorder in terms of percentage or “gas units” by calibrating the hot wire periodically with a gas-air mixture of known concentration. A second hot wire detector, set at a lower temperature, allows discrimination of total gas (all combustible hydrocarbon gases) from petroleum vapors (combustible hydrocarbon gases other than methane). This aids in identifying the types of hydrocarbons in place (that is, oil or gas).
Extraction efficiency
The efficiency of the device can vary from 30 to 70% and is somewhat affected by drilling practices. Pump rate, mud level, and rheology influence flow rates through the trap and are factors in the efficiency of the trap (see Show evaluation). Mud and ambient air temperature around the trap and vacuum line affect the relative efficiency with which light and heavy hydrocarbons are extracted and retained in the gas phase. This latter effect is most noticeable in areas of high diurnal temperature.
Numerous mechanical factors can affect trap efficiency:
- Revolutions per minute and surface area of impeller blades
- Vacuum strength
- Ditch or trap blocked by cuttings
- Air mixture
Extraction efficiency is also affected by the following factors:
- Drilled volume—The volume of gas seen in the drilling mud depends upon the volume of formation cut by the bit. Rate of penetration (ROP) increases will increase the volume of the formation cut per unit of mud pumped and therefore the volume of gas liberated. However, ROP increases may reflect increasing porosity and, at constant gas saturation, increasing gas liberated. Comparing ROP, cuttings lithology, and all three total hydrocarbon curves may help in interpretation.
- Crushed volume—The crushed volume of formation is recovered at the surface in the flowing mudstream. If the mudflow rate is increased, the cuttings are dispersed in a larger volume of mud, and the percentage of gas in mud is reduced.
- Permeability—If permeability is excellent or nonexistent, then the mudflow rate will have no effect on mud and cuttings blender test results. However, with moderate permeability, the mudflow rate and the resulting lag time will have some effect on the amount of gas that is allowed to expand and escape from the cuttings into the mud.
- Pressure and temperature—As the cuttings are recovered at the surface, both pressure and temperature decline. With declining pressure, the gas expands and escapes from solution in oil or water and all three fluids are displaced from the cuttings. Conversely, declining temperature causes heavier alkane vapors to condense, decreasing the total fluid volume and the proportion of gas in the mud and cuttings (see Show evaluation).
All of these factors combine to modify the type and quantity of gases contained in the cuttings and mud and extracted from them at the surface. The influx of fluids from the borehole wall and cavings will also have an effect. None of these effects are sufficient alone or in combination to invalidate the total hydrocarbon log as an indicator of gas-filled porosity in the formation. It does mean, however, that care must be taken when comparing total hydrocarbon indicators with rate of penetration.
An alternative to the conventional gas trap is the steam or vacuum mud still. In this device, a small sample of drilling mud is collected at the ditch and distilled under vacuum. The method provides a relatively high and uniform extraction efficiency for all hydrocarbons. It is, however, a time-consuming manual process.
Gas chromatography
Most logging units contain a gas chromatograph (see Mudlogging: equipment, services, and personnel). The hydrocarbon gas chromatograph is probably the most accurate and most consistent of the data recorded on the mudlog.
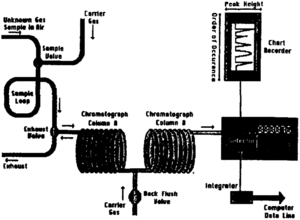
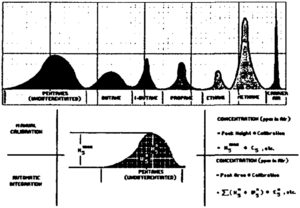
In gas chromatography, a fixed volume gas sample is carried through a separating column by a carrier gas, usually air (Figure 3). The column contains liquid solvent surface or a fine molecular sieve solid. By difference in gas solubility or by differential diffusion, the gas mixture becomes separated by molecular weight into its components, the lightest traveling quickly through the column and the heaviest more slowly. Common alkanes detected within a reasonable time frame include
- Methane (C1)
- Ethane (C2)
- Propane (C3)
- Isobutane (C4)
- Pentane(C5)
The chromatograph does not provide a continuous analysis but rather processes batch samples separated by a number of minutes. The gasses are usually presented as units based on peak height (Figure 4). They can also be noted in parts per million, percentage, mole fraction, or British thermal units. Integration of the area under the curve gives a better representation of the proportions but requires a more expensive device.
Calibration
Chromatographs are calibrated by injecting a known volume of test gas into an injection port. The test gas consists of an accurately measured mixture of methane, ethane, propane, isobutane, and normal butane. As the test gas cycles through the chromatograph, curve peaks are noted for each component gas. Formation gas readings can then be compared to the cycle peaks to derive wellbore gas values. Calibration should be done routinely on a daily basis and additional checks should be performed shortly in advance of penetrating critical zones. The Society of Professional Well Log Analysts[2] has published standards for the calibrating of total gas and chromatographs detectors.
See also
- Introduction to wellsite methods
- Drilling problems
- Mudlogging: drill cuttings analysis
- Drilling fluid
- Mudlogging: equipment, services, and personnel
- Show evaluation
- Mudlogging: the mudlog
