Oil and condensate analysis
Data from analysis of oils and condensates can contribute to the effective development and management of petroleum fields. These data also can be essential for equity studies and for environmental or pollution cases. Table 1 provides a quick reference to common questions that can be answered with the use of oil and condensate analyses. However, chemical analysis data, such as provided by gas chromatography, must be integrated with geological, engineering, and wellsite information to make these interpretations (Figure 1).
| Situation | Questions | Analysis |
|---|---|---|
| Oil on pits | Drilling additive or contaminant or formation fluid | GC |
| Oil show in core or cuttings | Oil quality and source | GC, HPLC, and GCMS |
| Unknown source rock for oil | Expected oil or unexpected oil (new play) | Bulk properties, GC, HPLC, GCMS, and carbon isotopes |
| Poor production test flow rates | Low viscosity (due to oil source or biodegradation) or high wax paraffinic | Bulk properties, GC, and HPLC |
| Casing leak | Producing zone oil or new zone | GC and carbon isotopes |
| Reservoir continuity | Lateral or vertical continuity | GC |
| Monitor multizone production | Production allocation (well head samples, low cost) | GC |
| Workover evaluation | New oil (zone) or same oil | GC |
Sampling[edit]

The key to useful data depends on proper sampling. Provisions for proper sampling of oils and condensates should be included in all well proposals, tests, completions, and workover programs. The following list gives when to sample wells for oils:
- When FTs or DSTs recover oil and/or water
- After completion, as soon as stream has cleaned up
- When water cut becomes significant
- On recompletion, prior to shutting in zone to be abandoned
- After recompletion, as soon as stream has cleaned up
- When unexplained production changes occur
- Prior to abandonment
- Any time a specific problem occurs
- When sampling nearby or associated wells
Note that when sampling, always sample the following:
- All streams or multiple completions
- Each stream for both hydrocarbons and water
- Streams that may have a bearing on the subject well
- Pertinent neighboring wells, if sampling is permitted
The expected character of the petroleum (such as API gravity and gas to oil ratio) and reservoir conditions (such as pressure and temperature) must be considered so that representative samples can be obtained. Changes in pressure and flow rate during well testing can alter petroleum composition and physical properties. In addition, samples of drilling mud, load and kill fluids, drilling additives, and wellsite fuel oils and lubricants should be kept until petroleum analyses are completed. If contamination is discovered or suspected, these samples can be analyzed and compared to recovered “petroleum.”
For drilling wells, all recovered fluids should be sampled, including shows, oil on the pits, DSTs, and formation tests. Drill cuttings and core samples may be solvent extracted to obtain liquid samples. For completed wells, each zone test should be sampled before, during, and after workovers, and prior to abandonment. For reservoir continuity studies or production allocation, samples should be collected as necessary.
Ideally, samples should be collected and stored in glass bottles or jars to minimize contamination. Plastic and rubber caps or stoppers should not be used unless they are made of Teflon. Samples captured in pressure bombs should be sent to the lab in the bomb.
If glass bottles are not available at the wellsite, other temporary containers can be used as long as they are clean and can be capped to minimize the loss of gas and gasoline components. These samples can then be transferred to suitable bottles at the lab.
Analysis[edit]
Many different types of analyses are available. To determine the best and most economic techniques, it is essential to know why analyses are to be run. A variety of common analyses are run for both bulk properties and for molecular composition. Procedures established by the American Society for Testing Materials are used unless proprietary techniques supersede them.
Bulk properties[edit]
The most commonly run analyses performed on bulk samples are
- API gravity
- Viscosity
- Pour point
- Gas to oil ratio (GOR)
- Percentage sulfur
- Carbon isotopes
Bulk properties should be measured on all test samples and measured (or estimated) on shows. They are essential for calculation of fluid properties, reserves, and economic value. They also are critical to the design of production methods and refinery processes. (For more on oil and condensate properties, see Petroleum reservoir fluid properties).
Variations in these properties can be used to test exploration models and evaluate development strategies. All of the basic bulk properties are affected by geological mechanisms that produce variations in oil composition (Table 2[1][2]).
| Mechanism | |
|---|---|
| Before accumulation |
|
| After accumulation |
|
Molecular composition[edit]
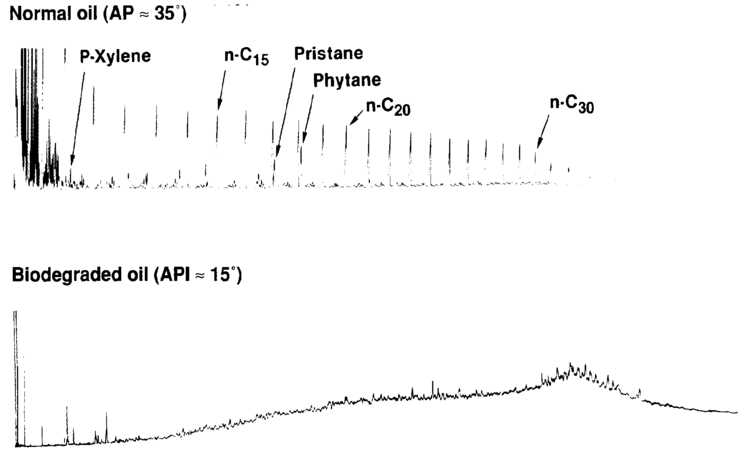
Figure 2 Gas chromatograms of a “normal” 35° ]]API gravity]] oil and a biodegraded oil showing the lose of aliphatics (n-paraffins and isoprenoids) due to biodegradation.
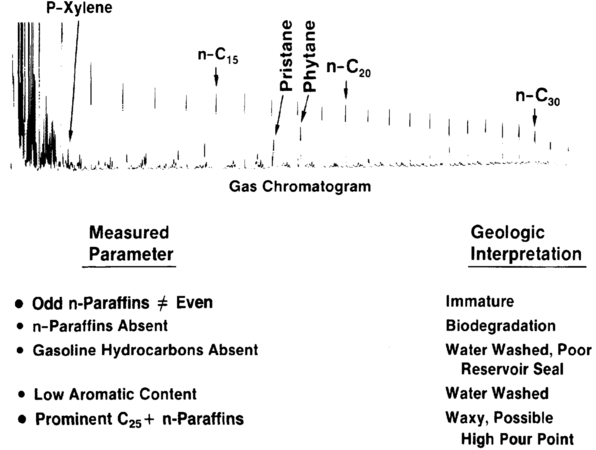
Figure 3 Gas chromatography can be used to determine geological processes experienced by an oil.
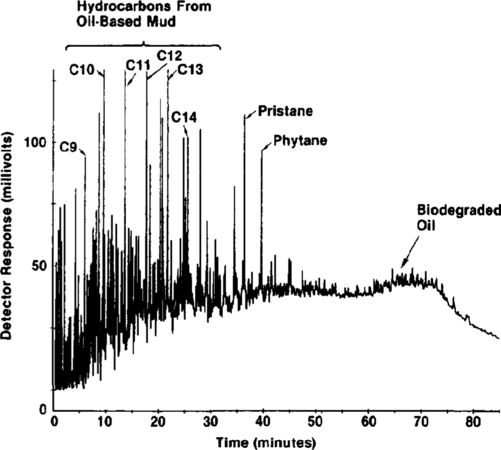
Figure 4 Gas chromatogram showing drilling mud contamination to a biodegraded oil.
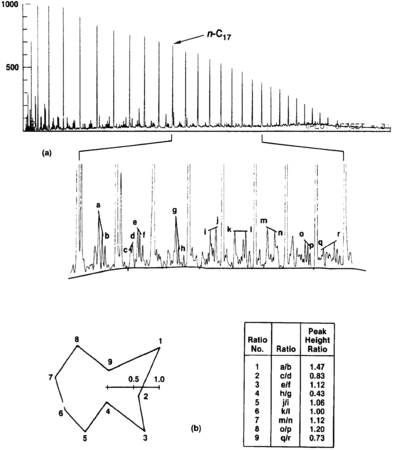
Figure 5 (a) Gas chromatographic data can be displayed as chromatograms at different attenuations, (b) as star diagrams of selected peak height ratios, or (c) as data tables of peak height ratios. The star diagram is a polar plot of the peak height ratio data from the table, which shows data from the chromatographic trace for peaks between n-C17 and n-C25.


The most common analyses done to determine molecular composition are as follows (see Altgelt and Gouw[3] and Tissot and Weite[1] for a description of these analyses and their applications):
- Gas chromatography (GC)
- High performance liquid chromatography (HPLC)
- Porphyrin distribution
- Gas chromatography-mass spectroscopy (GCMS)
Molecular compositions can be used to categorize oils (such as waxy or paraffinic and aromatic) and to determine the effects of geological processes (such as biodegraded, water washed, or immature). Bulk properties such as API gravity can sometimes be predicted from molecular composition data.[4] Chromatographic methods are typically used to determine these characteristics.
Gas chromatography (GC) data can indicate the geological mechanisms responsible for changes in composition of an oil. For example, during biodegradation, bacteria preferentially remove the n-paraffins that are prominent features in most chromatograms (Figure 2). Therefore the decrease or absence of n-paraffins is a strong indication that an oil is biodegraded. Other geological processes recognizable from chromatograms are thermal immaturity (odd-even predominance of the n-paraffins), water washing (depletion of light aromatics), leaky reservoir seals (loss of light ends), and source characteristics (biomarkers) (Figure 3). Drilling additives and contaminants can also be identified by chromatography (Figure 4).
If proper standardized procedures are followed, chromatograms can provide reproducible “fingerprints” of oils. These oil fingerprints can then be used to compare and correlate oils. This technique of molecular characterization is more discriminating than bulk property data.[5] For ease in interpretation, chromatographic data can also be displayed as polar or star plots of hydrocarbon peak ratios (Figure 5).
Gas chromatography should never be used alone to make these interpretations. Supporting analytical data and geological information should be obtained as well. A combination of several processes (that is, multiple sources for oils and/or different thermal maturities) can make interpretation complex.
Applications[edit]
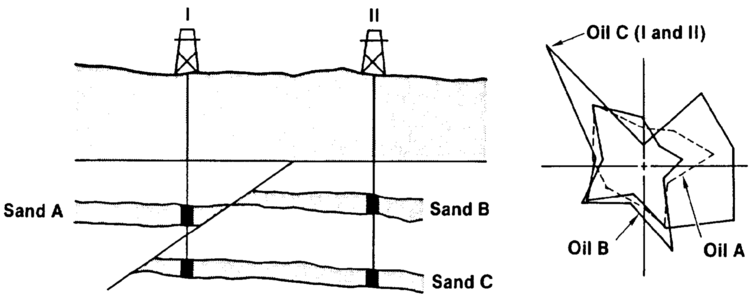
Figure 6 Gas chromatographic data can be used to determine oil reservoir continuity in conjunction with other methods such as pressure-depth plots. Diagram on right shows a graphical comparison of chromatographic data.
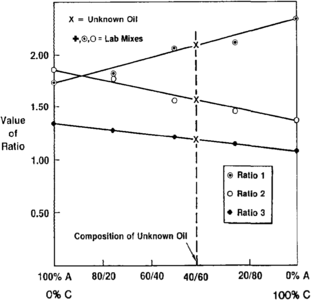
Figure 7 A binary mixing diagram showing how the relative proportions of an unknown oil can be determined using the two end-member oils (separate zones) and laboratory mixtures.


Correlation of recovered fluids to other oils or source rock extracts can verify exploration models for development of new plays[1][2]
Correlation techniques, especially gas chromatography, have also been used for the following development applications:
- Reservoir continuity studies[6][7]
- Identification of producing and nonproducing zones[8]
- Identification and localization of production problems[5]
- Allocation of production to specific intervals when production is commingled[9]
For example, in a formation that has a continuous oil reservoir, the fingerprint of that oil does not change, in other words, a change in a fingerprint reflects a discontinuous reservoir. Therefore, by sampling reservoirs vertically and laterally, it is possible to determine reservoir continuity. Figure 6 shows a schematic drawing of two reservoir sands that actually define three separate reservoirs. Although geologically equivalent, sands A and B are discontinuous and should be produced as separate reservoirs. Sand C is laterally continuous but vertically discontinuous from both sands A and B. The star diagram shows a representation of the different oil fingerprints. If production from sands A and C in well 1 is commingled, production could be allocated to the individual sands by using the fingerprint differences with a binary mixing model.[9] Figure 7 illustrates this with a simple mixing diagram.
In addition, if the fingerprint of oil from zone A, for example, is not found in the produced oil, this would indicate no production from zone A. The reason for lack of production could be depletion or watering out of a previously productive zone or the presence of a nonproductive or wet zone.
See also[edit]
References[edit]
- ↑ 1.0 1.1 1.2 Tissot, B. P., and W. H. Weite, 1978, Petroleum Formation and Occurrence: New York, Springer-Verlag, 538 p.
- ↑ 2.0 2.1 Hunt, J. M., 1979, Petroleum Geochemistry and Geology: San Francisco, CA, W. H. Freeman, 617 p.
- ↑ Altgelt, K. W., and T. H. Gouw, 1979, Chromatography in Petroleum Analysis: New York, Marcel Dekker.
- ↑ Kennicutt, M. C., and J. M. Brooks, 1988, Surface geochemical exploration studies predict API gravity off California: Oil and Gas Journal: Sept. 12, p. 101–106.
- ↑ 5.0 5.1 Kaufman, R. L., A. S. Ahmed, and R. J. Elsinger, 1990, Gas chromatography as a development and production tool, in Geochemistry of Gulf Coast Oils and Gases: Proceedings of the 9th Annual Research Conference, Gulf Coast Section, Society of Economic Paleontologists and Mineralogists, p. 263–282.
- ↑ Slentz, L. W., 1981, Geochemistry of reservoir fluids as a unique approach to optimum reservoir management: Middle East Oil Technical Conference of the Society of Petroleum Engineers, Manama, Baharain, SPE 9582.
- ↑ Ross, L. M., and R. L. Ames, 1988, Stratification of oils in Columbus Basin off Trinidad: Oil and Gas Journal, Sept. 26, p. 72–76.
- ↑ Maness, M., and J. G. W. Price, 1977, Well formation characterization by residual hydrocarbon analysis: Annual Meeting of the Society of Petroleum Engineers, Denver, CO, Oct. 9–12, SPE 6860.
- ↑ 9.0 9.1 Kaufman, R. L., A. S. Ahmed, and W. B. Hempkins, 1987, A new technique for the analysis of commingled oils and its application to production allocation calculations: 16th Annual Convention Proceedings of the Indonesian Petroleum Association, p. 247–268.
External links[edit]
| find literature about Oil and condensate analysis |