Oilfield water analysis
| Development Geology Reference Manual | |

| |
| Series | Methods in Exploration |
|---|---|
| Part | Laboratory methods |
| Chapter | Oilfield water analysis |
| Author | Parke A. Dickey |
| Link | Web page |
| Store | AAPG Store |
The principal reasons for performing chemical analysis of water produced with oil are to
- Determine its source
- Determine water resistivity (Rw)
- Detect hydrocarbon-related compounds
- Trace the path and location of injected water
Methods
Sampling
A truly representative sample can best be obtained from the flow line. Another sampling method is by drill stem tests, although this water is usually contaminated with filtrate from the drilling mud. (For more details, see Drill stem testing.) Additional sampling methods include formation testers such as the formation interval tester (FIT) and the repeat formation tester (RFT), which due to their ability to hold a limited volume, usually recover only filtrate. (For more on formation testers, see Wireline formation testers.)
Analytical methods
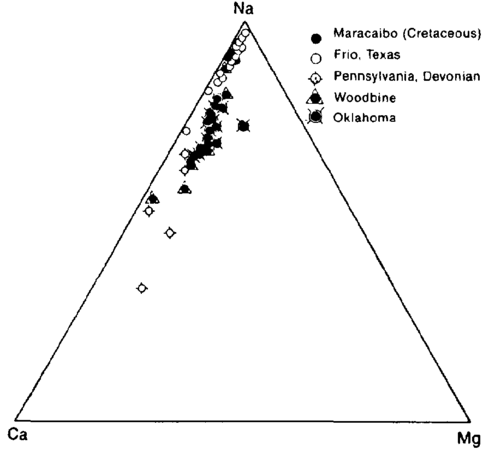
Figure 1 Triangular plot showing relative amounts of cations in typical oil field brines. Relative amount of sodium changes, but calcium is always about five times magnesium. (After Dickey.[1])
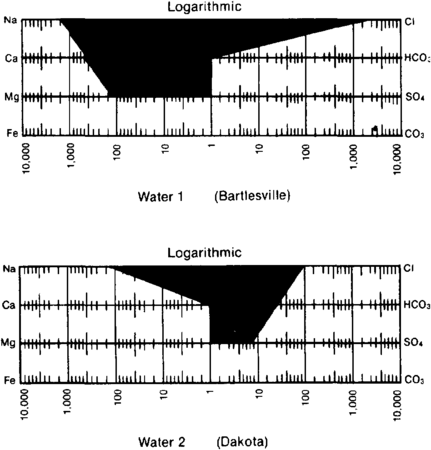
Figure 2 Stiff[2] diagrams used to show water compositions on maps.


In the past, only the six principal elements were reported. Only five of these were determined by analysis: calcium, magnesium, chloride, alkalinity (usually reported as bicarbonate), and sulfate. Sodium was estimated by difference. Results were reported as parts per million (ppm), but because the methods are volumetric, it is more correct to report those results as milligrams per liter (mg/L). Recently, physical methods such as atomic absorption and spectrometry have made it possible to analyze for the less abundant elements.[3] Some elements, such as barium, are important because they precipitate and plug pores. Others such as iodine and bromine may be economically profitable to recover. (For more on properties of reservoir water, see Petroleum reservoir fluid properties.)
Interpretation
In interpreting water analyses, it is customary to use reacting values (also called equivalent parts per million). The reacting value is the weight of the element in parts per million divided by the atomic or molecular weight and multiplied by the valence. In comparing waters, it is also useful to calculate the milliequivalent percent (Table 1). Because there are usually three principal cations and three anions, the milliequivalent percent can be plotted on a triangular diagram (Figure 1).
| Element | Factor | Water 1 | Water 2 | ||||
|---|---|---|---|---|---|---|---|
| mg/L | meq | meq % | mg/L | meq | meq % | ||
| Na+ | 0.0435 | 44,100 | 1918 | 74 | 3040 | 132.2 | 99 |
| Ca2+ | 0.0499 | 11,000 | 549 | 20 | 21 | 1.0 | 0.5 |
| Mg2+ | 0.0823 | 1,500 | 123 | 6 | 7 | 0.6 | 0.5 |
| Total cations | 2590 | 100 | 133.8 | 100 | |||
| Cl– | 0.0282 | 91,800 | 2589 | 100 | 3240 | 91.4 | 70 |
| SO42– | 0.0208 | None | — | — | 407 | 8.5 | 6.5 |
| HCO3– | 0.0164 | 34 | 0.5 | — | 1870 | 30.7 | 23.5 |
| Total anions | 2590 | 100 | 130.6 | 100.0 | |||
In plotting water composition on maps, it is convenient to show the analyses in the form of patterns. One of the most commonly used patterns was devised by Stiff.[2] The cations are plotted to the left on three or four lines, and the anions are plotted to the right. Milliequivalents are usually plotted on a logarithmic scale (Figure 2).
Applications
When a well starts to make water, it is necessary to find out where the water is coming from to determine what actions, if any, are needed. Another important reason for sampling and analyzing water is to determine its resistivity (Rw). This value is needed to determine its saturation (Sw) in the producing formation by wireline log analysis. Consequently, some well logging societies have compiled Rw values for different regions.
Water from dry holes is sometimes analyzed for traces of hydrocarbon-related organic compounds, such as organic acids and benzene. If they are found, it suggests that the formation had an oil accumulation in the vicinity.[4]
Water for subsurface injection should be carefully filtered and analyzed for its chemical composition. Injection water is filtered because it must be free of suspended matter that might plug the rock pores or coat the faces of the grains. This matter might be bacteria or algae and can be mitigated by including bactericides in the water. Harmful matter can also arise from corrosion of the steel pipes, so it is customary to keep dissolved oxygen out of the injection water. (For information on corrosion and scale, see Production problems.)
Injected water can also cause authigenic clays in the pores to swell and/or migrate. Injected water may react with interstitial water, forming precipitates that also plug the pores and create formation damage. This reaction can be predicted from chemical analysis. (For more on formation damage, see Rock-water reaction: formation damage.)
See also
- Core description
- Porosity
- Relative permeability
- Paleontology
- Wettability
- Oil and condensate analysis
- Capillary pressure
- Permeability
- SEM, XRD, CL, and XF methods
- Thin section analysis
- Rock-water reaction: formation damage
- Overview of routine core analysis
- Core-log transformations and porosity-permeability relationships
References
- ↑ Dickey, P. A., 1966, Patterns of chemical composition of deep subsurface waters: AAPG Bulletin, v. 50, p. 2472–2478.
- ↑ 2.0 2.1 Stiff, H. A., 1951, The interpretation of chemical water analyses by means of patterns: Journal of Petroleum Technology, v. 3, p. 15–1710., 2118/951376-G
- ↑ American Society for Testing Materials, 1990, Water and environmental technology: ASTM, v. 11., 01, 612 p., and v. 11., 02, 878 p.
- ↑ Zarella, W. M. 1967, Analysis and significance of hydrocarbons in subsurface brines: Geochimica et Cosmochimica Acta, n. 13, p. 1155–1166., 10., 1016/S0016-7037(67)80054-1
External links
| find literature about Oilfield water analysis |