Open hole tools
| Development Geology Reference Manual | |

| |
| Series | Methods in Exploration |
|---|---|
| Part | Wireline methods |
| Chapter | Basic open hole tools |
| Author | Mark W. Alberty |
| Link | Web page |
| Store | AAPG Store |
Purpose and types
Open hole logging devices are used to characterize subsurface formations. Common formation attributes that may be characterized include
- Storage capacity of the formation, which normally includes porosity and fluid saturations
- Fluid properties, which include density, gas to oil ratio, API gravity, water resistivity and salinity, temperature, and pressure
- Geological setting, which may include structural or stratigraphic dip, facies characteristics, and reservoir heterogeneities
The basic open hole wireline logging devices can be divided into four general groups, as shown in Table 1. The correlation and lithology devices are used primarily to correlate between wells and to discriminate reservoir from nonreservoir rocks. The resistivity devices are used to determine formation resistivity at varying distances from the wellbore, which is used for correlation and the determination of water saturation. The lithology and porosity devices are used to determine both lithology and porosity. A variety of auxiliary tools are used to make special logging measurements. (For more on tool specifications, see Basic tool table.)
| Type | Devices |
|---|---|
| Correlation and lithology | Spontaneous potential |
| Gamma ray | |
| Photoelectric effect | |
| Resistivity | Induction |
| Laterolog | |
| Microresistivity | |
| Porosity and Lithology | Density |
| Compensated Neutron | |
| Sonic | |
| Photoelectric effect | |
| Auxiliary | Caliper |
| Formation Tester | |
| Dipmeter | |
| Borehole Televiewer |
Correlation and lithology
Correlation devices are used to identify common formations between wells and to distinguish potential reservoir rocks from nonreservoir rocks. These devices make use of three different physical phenomena: spontaneous potential, gamma rays, and photoelectric effect. Table 2 shows the resolution and applications of the correlation devices.
| Tool | Vertical Resolution | Radius of Investigation | Applications | Limitations |
|---|---|---|---|---|
| Spontaneous potential (SP) | 6–10 ft | N/A | Well-to-well correlation, estimate Rw , and indicate permeability | Does not work in oil-based mud and Rmf and Rw must contrast |
| Gamma ray | length::2 ft | length::12 in | Well-to-well correlation and estimate Vsh | Sensitive to hole size changes |
| Spectral gamma ray | length::3 ft | length::16 in | Well-to-well correlation and estimate Vsh | Sensitive to hole size changes |
| Photoelectrical effect (Pe) | length::2 in | length::2 in | Identify lithology and well-to-well correlation | Does not work in barite mud, is a pad device, and uses a radioactive source |
Spontaneous potential
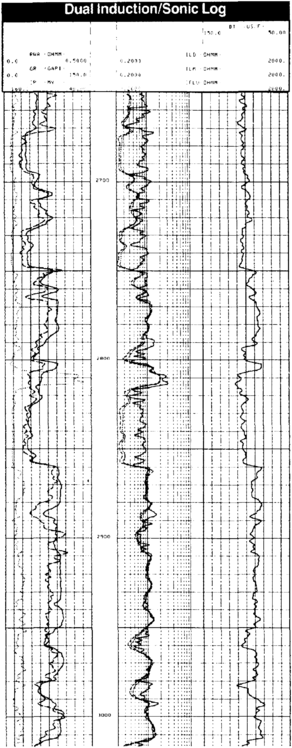
Figure 1 A typical log showing SP, gamma ray, dual Induction, and sonic measurements. © Schlumberger.[1]
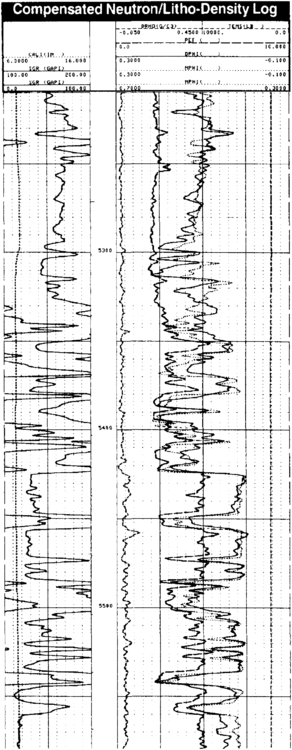
Figure 2 A typical log showing density, compensated neutron, Pe, gamma ray, and caliper measurements. © Schlumberger.[1]


Spontaneous potential (SP) is a natural voltage or electrical potential that arises due to differences in the ionic activities (relative saltiness) of the drilling mud and the formation waters. This potential can be used to correlate formations between wells, to indicate permeability, and to estimate formation water resistivity. No SP occurs when oil-based mud is used in the borehole. Hydrocarbons and shaliness in the formation suppress the SP. The magnitude of the SP decreases as the resistivity of the mud filtrate and formation waters approach a common resistivity. The direction of SP deflection reverses as the ratio of the resistivity of the mud filtrate (Rmf) to that of the formation water (Rw) reaches 1.0 or more. If there is no contrast in the mud filtrate and formation water salinities, there is no measurable SP. A typical presentation of SP is shown on the left of the log in Figure 1.
Gamma ray
Gamma rays tools measure the natural radioactivity of the formation. This radioactivity is emitted primarily from potassium in the structure of clay minerals, radioactive salts in the formation waters, radioactive salts bound to the charged surfaces of clay minerals, potassium associated with feldspars, and radioactive minerals associated with igneous rocks and rock fragments. The gamma ray response is used for correlation of formations between wells and for estimating volume shale and/or volume clay minerals.
An advanced version of the gamma ray tool, called the spectral gamma ray, breaks down or segments the detected gamma rays by their different energies using spectral analysis techniques. These segments correspond to the radioactive families of potassium, uranium, and thorium. Uranium frequently occurs as a precipitated salt deposited in a formation from waters having flown through that formation. When this occurs, the uranium counts disguise radioactivity due to mineralogy. The use of the spectral tool allows the removal of gamma ray counts caused by uranium, typically permitting more accurate use of the remaining gamma rays for determining lithology, volume shale, or volume clay. In some local areas, ratios of potassium to thorium have been successfully used to determine some clay types. However, this clay typing has not proven particularly universal and should be attempted with much caution.
Typical presentations of gamma ray measurements are shown in the logs in both [[::file:basic-open-hole-tools_fig1.png|Figures 1]] and 2. (For information on the cased hole gamma ray tool, see Basic cased hole tools)
Photoelectric effect
The photoelectric effect, or Pe, measures a formation's ability to absorb gamma rays. The absorptive abilities of formations vary with lithology. The photoelectric absorption is recorded as a supplementary measurement to the formation density measurement, using common detectors and radioactive sources. Since this measurement is part of the density measurement, the tool is a pad contact tool and is subject to borehole wall rugosity. The measurement is not valid in muds weighted with barite. The recording can be used both for correlation of formations between wells and for determining lithology. A typical presentation of Pe is shown in the log in Figure 2.
Resistivity
Resistivity tools are primarily used for correlation and to determine the volume of the pore space saturated with water. Resistivity tools can be divided into three characteristic types: induction, laterolog, and microresistivity tools. The three types each have their individual applications, advantages, and limitations, which are summarized in Table 3.
| Tool | Vertical Resolution | Radius of Investigation | Applications | Limitationsb |
|---|---|---|---|---|
| Dual induction | ||||
| Deep | 7 ft | 50 in. | Estimate Rt, Rxo, and Di in relatively fresh and oil mud systems | Not recommended; Res > 200 Ω-m or Rmf / Rw < 2.5 |
| Medium | 5 ft | 28 in. | ||
| Shallowa | 2.5 ft | 16 in. | ||
| Phasor induction | ||||
| Deep | 3 ft | 65 in. | Estimate Rt, Rxo, and Di in relatively fresh and oil mud systems; reduced shoulder effects | Not recommended; Res > 250 Ω-m or Rmf / Rw < 2.5 |
| Medium | 3 ft | 40 in. | ||
| Shallowa | 2.5 ft | 16 in. | ||
| High resolution induction | ||||
| Deep | 2.5 ft | 95 in. | Estimate Rt, Rxo, and Di in relatively fresh and oil mud systems; reduced shoulder effects | Not recommended; Res > 250 Ω-m or Rmf / Rw < 2.5 |
| Medium | 2.5 ft | 60 in. | ||
| Shallowa | 2.5 ft | 16 in. | ||
| AIT* | 4 ft. 2 ft. 1 ft | 10 in., 20 in., 30 in., 60 in., 90 in. | Estimate Rt, Rxo, and Di in relatively fresh and oil mud systems; reduced shoulder and rugosity effects | Not recommended; Res > 200 Ω-m or Rmf / Rw < 2.5 |
| Dual laterolog | ||||
| Deep | 2 ft | 45 in. | Estimate Rt, Rxo, and Di in relatively salty mud | Not recommended; Rmf / Rw > 2.5; does not work in oil based mud |
| Shallow | 2 ft | 16 in. | ||
| Microresistivity | (See below) | |||
| ARI* | 8 in. | 4 ft | Estimate Rt, Rxo, and Di in relatively salty mud, locate fractures | Resistivity range 0.2 to 100,000 Ω-m |
| Micro SFL | 2-3 in. | 1–4 in. | Permeability and moved hydrocarbon indicator; estimate Rxo | No oil-based muds |
| Microlaterolog | 2 in. | 4 in. | Permeability and moved hydrocarbon indicator; estimate Rxo | No oil-based muds |
| Microlog | 2-4 in. | 1-2 in. | Permeability and moved hydrocarbon indicator; estimate Rxo | No oil-based muds |
aShallow measurements do not work in oil-based muds.
bThe ohm-meter (Ω-m) is a unit of measurement of resistance.
*Mark of Schlumberger
Induction
Induction tools use electromagnetic coils to establish magnetic fields that excite current flow in the formation, which in turn excites secondary magnetic fields and current flow in receiver coils in the tool. This principle of exciting magnetic fields allows induction tools to measure resistivity without the requirement of a direct electrical connection to the formation. This feature permits the tool to be used in nonconductive muds. Different transmitter and receiver arrays allow focusing of the measurement for different vertical resolution and depths of investigation. A typical presentation of a dual induction log is shown in Figure 1.
Laterologs
The laterolog device measures the voltage and current magnitudes associated with a series of current electrodes mounted on the surface of the logging sonde. These measurements require direct electrical contact with the formation, which is normally provided by the drilling mud. This characteristic does not allow this measurement to be made in oil-based muds. The focusing of the laterolog measurement is accomplished through the placement of the electrodes. Generally, laterologs exhibit very good vertical resolution. Because the measured currents must pass through the drilling mud and the flushed zone to enter the unaltered formation, laterolog measurements are usually unfavorably influenced by nonconductive mud and mud filtrate. The presentation of the dual laterolog is very similar to the presentation of the dual induction shown in Figure 1.
The deep laterolog measurement current is returned to the earth's surface to ensure deep investigation and to minimize the influence of resistive beds. However, the surface return can give rise to anomalously high resistivity readings for tens of feet below massive, extensive, highly resistive beds. This phenomenon is known as the Groningen effect.
Microresistivity
Microresistivity devices are used to estimate the resistivity of the flushed zone immediately adjacent to the borehole. The devices are of the pad contact type to ensure that the investigation is very shallow and to minimize the influence of changing hole sizes and tool position within the borehole. This shallow investigation can result in mudcake being a significant influence. Hole size and mudcake corrections are commonly required. Like laterologs, these devices require a direct electrical contact with the formation. For this reason, microresistivity devices cannot be used in oil-based muds.
Formation resistivity is typically profiled with three resistivity measurements of different depths of investigation to characterize the influence of the invading mud filtrate upon apparent formation resistivity. This characterization permits the influence of the flushed zone to be separated from the reading of the deep device for a more accurate determination of the true formation resistivity (Rt).
Porosity
Each of the porosity tools—density, compensated neutron, sonic, and photoelectrical effect—can be used to estimate porosity when lithology and fluid properties are known. (Methods for estimating porosity from these devices individually are described in Standard interpretation.) When both porosity and lithology are unknown, two or more of the devices can be used together to determine both porosity and lithology. (The most common methods for determining both porosity and lithology are described in Quick-look lithology from logs.) Table 4 shows the resolution and applications of porosity devices.
| Tool | Vertical Resolution | Radius of Investigation | Applications | Limitations |
|---|---|---|---|---|
| Compensated density | 18 in. | 8 in. | Estimate porosity | Pad contact device |
| Compensated neutron | 2 ft | 10 in. | Estimate porosity and identify presence of gas | Needs environmental corrections; sensitive to standoff from wall |
| IPL* (Integrated Porosity Lithology) | 1 ft | -- | Estimate porosity and identify presence of gas, thin bed evaluation, shalt sand evaluation | Needs environmental corrections; sensitive to standoff from wall |
| Sonic | 2 ft | Typically 6 in. | Measure compressional velocity and estimate porosity | Sensitive to compressibility |
| FWS (monopole) | 4 ft | Typically 6 in. | Measure compressional and shear velocities and estimate porosity | Cannot measure shear velocity when shear velocity > mud velocity |
| Dipole sonic | 4 ft | Typically 12 in. | Measure shear velocity | — |
| CMR* (Combinable Magnetic Resonance) | 6 in. | 1 in. | Porosity, pore size distribution, permeability | Minimum 6.5 in. wellbore |
| Photoelectrical effect (Pe) | 2 in. | 2 in. | Identify lithology and correlation | Does not work in barite mud and pad contact tool |
* Mark of Schlumberger
Density
The density tool measures the apparent density of the formation using a radioactive source that bombards the formation with high energy gamma rays and then measures the number of lower energy gamma rays returning to the detectors. The detectors and source are mounted in a pad that is forced against the borehole wall. The measurement attempts to correct automatically for the effects of mudcake and minor hole rugosity. The measurement is sensitive to significant borehole wall rugosity and pad standoff, which cause the tool to read too low of a density. A typical presentation of the density (as well as several other parameters) is shown in the log in Figure 2.
Compensated neutron
Compensated neutron devices measure the hydrogen index of the formation using a radioactive neutron source that bombards the formation with fast-moving neutrons. Neutrons collide with atoms of the formation, transferring their energy through these collisions. The most efficient transfer of energy occurs with hydrogen atoms because the mass of hydrogen is approximately the same as the mass of a neutron. Two detectors count the number of deenergized (thermal) neutrons returning from the formation. The ratio of the detector count rates is primarily related to the hydrogen index or the apparent water-filled porosity.
The source and detectors are mounted in a mandrel that, ideally, is pressed against the borehole to minimize the influence of the high apparent porosity of the borehole. This measurement is very sensitive to tool standoff, hole size, temperature, and salinity. Environmental corrections are highly recommended before attempting to interpret results. Gas has a very low hydrogen index compared to water, which causes the tool to report abnormally low porosities in gas-bearing formations. When used in conjunction with density measurements, gas-bearing intervals are often easy to identify. A typical presentation of a compensated neutron measurement is shown in the log in Figure 2.
Sonic
Sonic devices measure the velocity of various acoustic waves, most notably compressional, shear, and Stoneley waves. The velocity of the waves is a function of the elastic properties and the density of the formation. Logs normally present the inverse of velocity, called the interval transit time or delta t (Δt). A number of empirical relationships have been developed to relate compressional velocity to porosity (which are explained in Standard interpretation).
Two versions of the compressional sonic device are available: the compensated sonic and the full waveform sonic (FWS). The full waveform sonic contains an array of receivers that are used to determine both compressional and shear velocities. Sonics are available in a variety of transmitter-to-receiver spacings from 3 to length::12 ft or more. The longer spacings are capable of investigating deeper into the formation. Both the conventional sonic and the full waveform sonic devices are used to measure compressional velocity. A typical presentation of compressional sonic measurements is shown in the log in Figure 1.
Shear velocities are used to determine mechanical properties of the formations and to determine Poisson's ratio for use in interpreting seismic data. Shear velocities can be determined from the FWS (monopole), the dipole sonic, or the quadrupole sonic. The monopole sonic is not able to measure shear velocities when the shear velocity of the formation is slower than the compressional velocity of the mud. Mud interval transit times are typically in the 190 μsec/ft range. When this condition is not met, no shear energy is refracted toward the receivers, making shear velocity measurements impossible. The dipole overcomes this limitation by directly exciting shear flexural energy in the formation regardless of the mud velocities.
Photoelectric effect
The photoelectric effect is used for lithology determination, and its measurement is identical to that described in the correlation subsection. Knowledge of lithology significantly improves the accuracy of interpretation of all the porosity measurements.
Auxiliary tools
A wide variety of auxiliary wireline tools exist for solving special problems. The more commonly encountered devices are summarized in Table 5. (For more information on other auxiliary tools, see Wireline formation testers, Dipmeters, and Borehole imaging devices.)
| Tool | Vertical Resolution | Radius of Investigation | Applications |
|---|---|---|---|
| Calipers | N/A | N/A | Determine borehole diameter |
| Formation testers | 0.5 in. | N/A | Measure formation pressures and recover formation fluid samples |
| Dipmeters | 0.4 in. | 1 in. | Structural dip, stratigraphic dips, and hole geometry |
| Formation microscanner | 0.2 in. | 1 in. | Structural dip, stratigraphic dips, formation images, and hole geometry |
| Televiewer | 0.5 in. | 0 in. | Structural dip, stratigraphic dips, formation images, and hole geometry |
| Formation MicroImager | 0.2 in. | 0 in. | As for Televiewer |
Calipers
Calipers come in a wide variety of types, the most common being one-arm, two-arm, three-arm, four-arm, and six-arm. One-arm calipers use the mandrel of the logging device as one side of the caliper and an arm extending out from the body of the sonde as the other. This technique is commonly used in density measurements. This configuration typically measures the long axis of an elliptical borehole. The measurement is unable to characterize accurately hole size changes less than the tool length on the “tool” side of the measurement.
The two-arm device has two caliper arms extending in opposite directions from the tool mandrel. This configuration typically measures the long axis of an elliptical borehole. This device is able to characterize small changes in hole size on both sides of the borehole. In deviated boreholes, the arm on the low side of the borehole will often collapse under the weight of the logging tool.
The three-arm device is normally a spring-loaded caliper with all three arms ganged to operate in unison. This causes the mandrel of the logging device to center in the borehole; thus, it is typically used with sonic tools for centralization. This device reports the shortest of the three measurements and frequently collapses under tool weight in deviated boreholes.
The four-arm device is typically used on a dipmeter. The most common configuration has opposite arms ganged to work together so that the tool mandrel is centralized in the borehole. One set of arms typically reports the long axis of an elliptical borehole, while the other set reports the short axis. Dipmeters usually have operator-adjustable pad pressure, which increases arm pressure to lift the mandrel of the tool in deviated boreholes. If insufficient pad pressure is applied, the calipers will underreport hole size in deviated boreholes. If excessive pad pressure is applied, the tool will display irregular tool motion as the tool stops and goes with cable tension.
See also
- Difficult lithologies
- Dipmeters
- Formation evaluation of naturally fractured reservoirs
- Basic tool table
- Introduction to wireline methods
- Determination of water resistivity
- Preprocessing of logging data
- Wireline formation testers
- Basic cased hole tools
- Standard interpretation
- Quick-look lithology from logs
- Borehole imaging devices
References
External links
| find literature about Open hole tools |