Petroleum system: geographic, stratigraphic, and temporal extent
| Exploring for Oil and Gas Traps | |

| |
| Series | Treatise in Petroleum Geology |
|---|---|
| Part | Traps, trap types, and the petroleum system |
| Chapter | Petroleum systems |
| Author | Leslie B. Magoon, Edward A. Beaumont |
| Link | Web page |
| Store | AAPG Store |
Petroleum systems are limited by time and space. Each system can be described in terms of its own unique temporal and spatial elements and processes.
Temporal aspects

The temporal extent of the petroleum system is shown on the events chart and includes the age of the essential elements and processes, the preservation time, and the critical moment. By displaying together the time over which these separate events took place, the relation between forming and charging the traps containing the accumulations is easily evaluated.
- Age
- Critical moment
- Preservation time
The age of a system is the time required for the process of generation-migration-accumulation of hydrocarbons.
The critical moment is the time that best depicts the generation-migration-accumulation of hydrocarbons in a petroleum system. A map and cross section drawn at the critical moment best show the geographic and stratigraphic extent of the system. The burial history chart (Figure 1) shows the critical moment and the essential elements for the fictitious Deer-Boar(.) petroleum system.
The preservation time of the petroleum system begins immediately after the generation-migration-accumulation process occurs and extends to the present day. It encompasses any changes to the petroleum accumulations during this period. During the preservation time, remigration, physical or biological degradation, or complete destruction of the petroleum may take place. During the preservation time, remigrated (tertiary migration) petroleum can accumulate in reservoir rocks deposited after the petroleum system formed. If insignificant tectonic activity occurs during the preservation time, accumulations remain in their original position. Remigration happens during the preservation time only if folding, faulting, uplift, or erosion occurs. If all accumulations are destroyed during preservation time, then the evidence that a petroleum system existed is absent. An incomplete or just completed petroleum system lacks a preservation time.
Spatial aspects
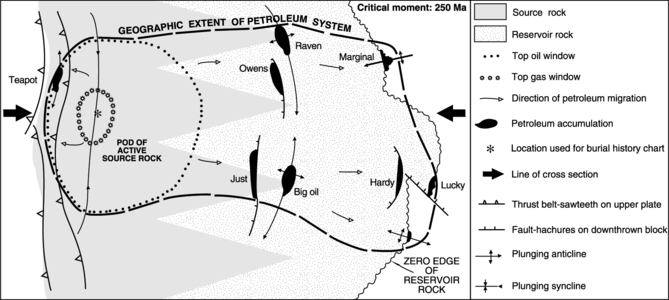
Figure 2 Geographic extent of the fictitious Deer-Boar(.) petroleum system. From Magoon and Dow;[1] courtesy AAPG.
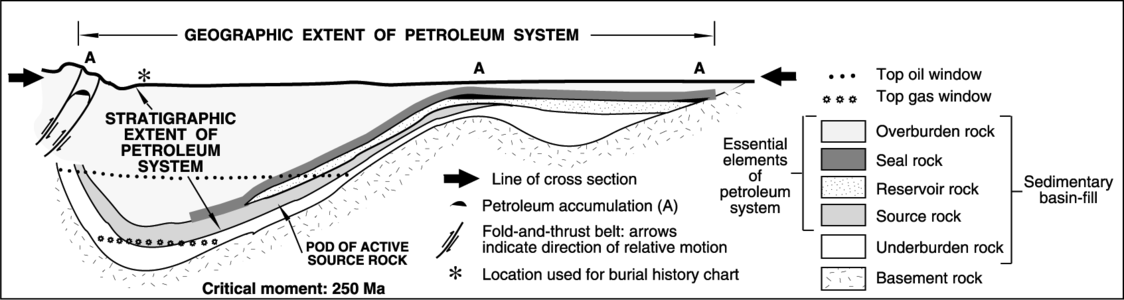
Figure 3 Stratigraphic extent of the fictitious Deer-Boar(.) petroleum system at the critical moment. From Magoon and Dow;[1] courtesy AAPG.


Each petroleum system can be defined spatially by its geographic and stratigraphic extent.
The geographic extent of a petroleum system is determined at the critical moment. It is defined by a line that circumscribes the pod of active source rock and all oil and gas seeps, shows, and accumulations originating from that pod. Figure 2 shows the geographic extent of the fictitious Deer-Boar(.) petroleum system.
The stratigraphic extent of a petroleum system is the span of lithological units which encompasses the essential elements within the geographic extent of a petroleum system. The stratigraphic extent is from below the pod of active source rock or the petroleum of the discovered accumulations in the system, whichever is deeper, to the top of the overburden rock.The stratigraphic extent can be displayed on the burial history chart and cross section drawn at the critical moment. Figure 3 shows the stratigraphic extent of the fictitious Deer-Boar(.) petroleum system at the critical moment.
What is an events chart?
An events chart shows the temporal relation of the essential elements and processes of a petroleum system. It also shows the preservation time and the critical moment for the system. An events chart can be used to compare the times that the processes occurred with the times that the elements formed.
Events chart example

A petroleum system events chart shows time on one axis and the essential elements and processes on the other. The time required for the generation-migration-accumulation process is the same as the age of the system. The chart also shows the preservation time and critical moment for the system. Figure 4 depicts the events chart for the fictitious Deer-Boar(.) petroleum system.
The events chart is arranged according to increasing difficulty. For example, mapping and dating the essential elements of a petroleum system are usually easier than mapping and determining the time over which the processes took place. Because the petroleum system deals only with discovered accumulations, there is no question that the elements and processes worked correctly to make oil and gas fields. Later, however, the events chart is transformed into a risk chart to better evaluate a play or prospect.
See also
References
- ↑ 1.0 1.1 1.2 1.3 Magoon, L. B., and W. G. Dow, 1994, The petroleum system, in L. B. Magoon and W. G. Dow, eds., The Petroleum System—From Source to Trap: AAPG Memoir 60, p. 3–24.
External links
| find literature about Petroleum system: geographic, stratigraphic, and temporal extent |