Predicting sandstone reservoir porosity
| Exploring for Oil and Gas Traps | |

| |
| Series | Treatise in Petroleum Geology |
|---|---|
| Part | Predicting the occurrence of oil and gas traps |
| Chapter | Predicting reservoir system quality and performance |
| Author | Dan J. Hartmann, Edward A. Beaumont |
| Link | Web page |
| Store | AAPG Store |
We might have the impression that abundant data and powerful computer models are necessary for porosity prediction. They help. But even with sparse data, by using a little imagination we can predict ranges of porosity. This section presents different methods of predicting sandstone porosity. Choose the method(s) most appropriate to your situation.
Porosity-depth plots

A pitfall of using porosity–depth plots for porosity prediction is that regression relationship averages out anomalies and complicates predictions of unusually porous sandstones. Use porosity–depth plots for porosity prediction with caution. If enough porosity data are available to make a meaningful plot, keep the “data cloud” on the plot in order to view the ranges of porosity at different depths. In a frontier exploration setting, the usefulness of porosity–depth plots may be limited if global data sets must be used.
Figure 1 is an example of regression porosity–depth plots for different formations along the U.S. Gulf Coast. Unfortunately it does not include the raw data, so we cannot see porosity variations within each formation. Formations on the left side of the plot, like the Vicksburg, tend to be quartz cemented. Formations on the right side, like the Frio (areas 4-6). tend to be clay cemented.
Equation for porosity prediction
Scherer[2] studied the cores of 428 worldwide sandstones and listed the most important variables for predicting sandstone porosity:
Using regression analysis, he developed the following equation:


where:
- Porosity = percent of bulk volume
- In quartz = percent of solid-rock volume
- Sorting = Trask sorting coefficient
- Depth = meters
- In age = millions of years
The equation can be used with a high degree of confidence in uncemented to partly cemented sandstones. But if the reduction of porosity by cement exceeds 2.1% bulk volume, then corrections need to be made based on local sandstone quality characteristics. Numbers for percent solid volume quartz and sorting may be difficult to obtain. Use 75% for percent solid volume quartz and 1.5 for sorting when these values are not known.
The table below shows numbers that Scherer[2] developed by his analysis of reservoir sandstones.
| Parameter | Unit | Range | Mean | Standard deviation |
|---|---|---|---|---|
| Porosity | Percent bulk volume | 3.9–36.6 | 20 | 7.9 |
| Age | Millions of years | 1–460 | 59 | 40.0 |
| Depth | Meters | 0–5,960 | 2,230 | 1,150.0 |
| Quartz | Percent solid rock volume | 12–97 | 75 | 23.0 |
| Sorting | Trask coefficient | 1.1–4.2 | 1.5 | 0.6 |
Predicting effects of diagenesis on porosity
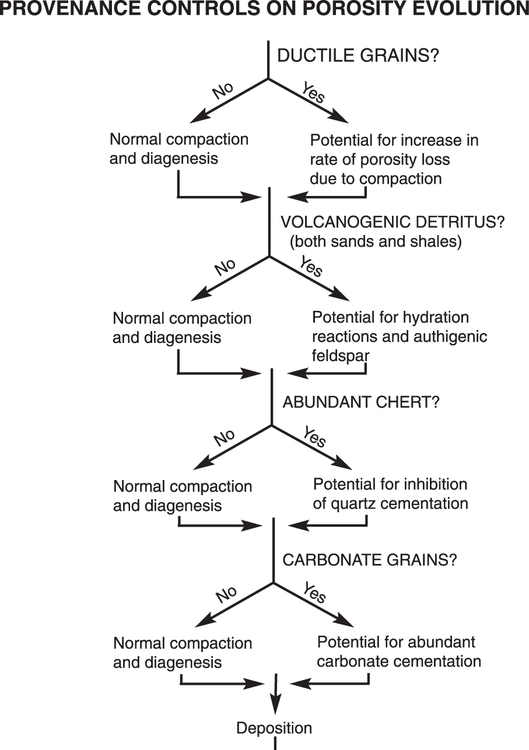
Figure 2 Flow chart to predict the effect of original sediment composition on subsequent diagenesis. Copyright: Surdam et al.;[3] courtesy RMAG.
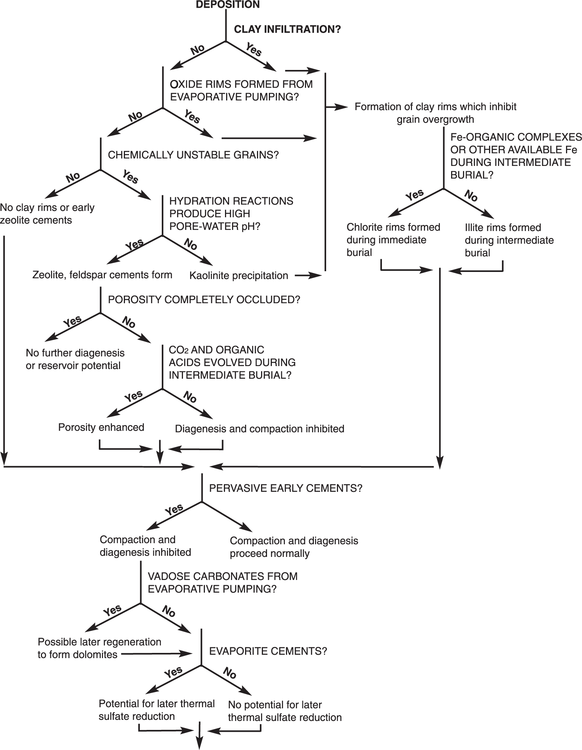
Figure 3 Flow chart to estimate the effects of near-surface diagenesis (depth to point where temperature reaches temperature::80°C. Copyright: Surdam et al.;[3] courtesy RMAG.
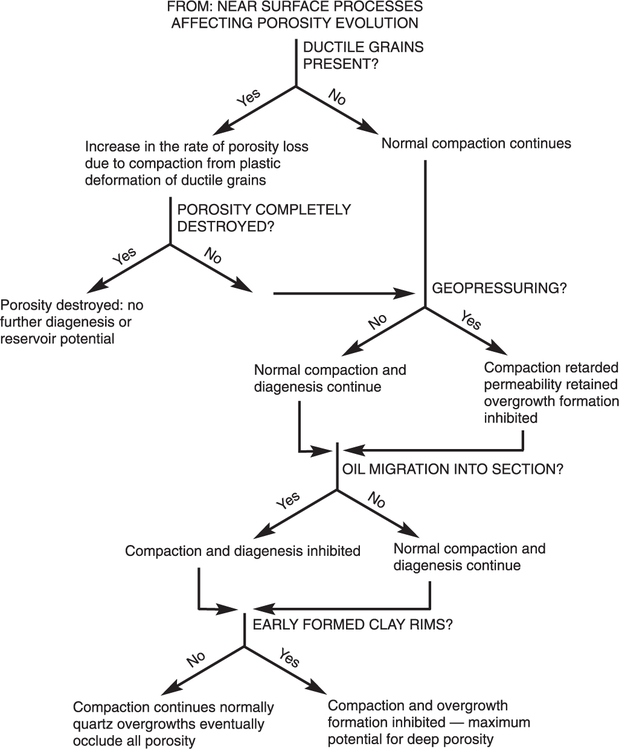
Figure 4 Flow chart to predict the effects of mechanical diagenesis on sandstone porosity. Copyright: Surdam et al.;[3] courtesy RMAG.


Sandstone porosity prediction is a matter of estimating original composition and subsequent diagenesis. Use the list below to predict sandstone porosity.
- Estimate the original composition of the sandstone from provenance (use Figure 2) and depositional environment.
- Estimate the effects of near-surface diagenetic processes (see Figure 3).
- Estimate the effects of mechanical diagenetic processes (see Figure 4).
- Estimate the effects of intermediate and deep burial diagenesis, especially with respect to the creation of secondary porosity.
- Using information collected in steps 1 through 4, predict the final porosity ranges using burial history (next procedure).
Predicting effect of provenance on diagenesis
Use the flow chart in Figure 2 to predict the effect of original sediment composition on subsequent diagenesis.
Estimating effect of near-surface diagenesis
Use the flow chart in Figure 3 to estimate the effects of near-surface diagenesis (depth to point where temperature reaches temperature::80°C).
Predicting effect of mechanical diagenesis
Use the chart in Figure 4 to predict the effects of mechanical diagenesis on sandstone porosity.
Using burial history to predict porosity
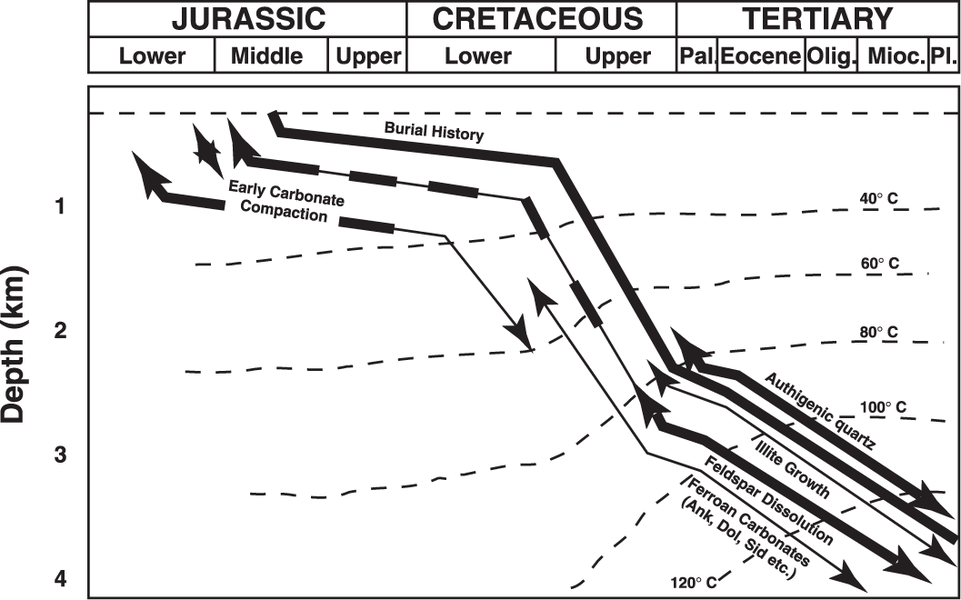
Figure 5 Diagram showing diagenetic and burial history for the Brent Group Sandstones, North Sea. Line thicknesses indicate relative abundance of diagenetic components. Copyright: Wilson;[4] courtesy SEPM.
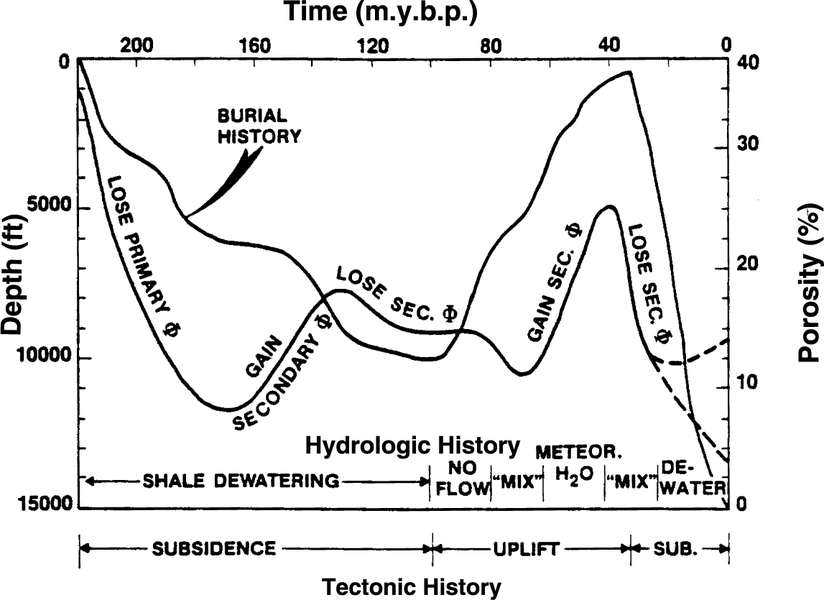
Figure 6 Example of sandstone porosity prediction using burial history. From Hayes;[5] courtesy AAPG.


Reconstructing burial history aids sandstone porosity prediction. Aburial history diagram integrates tectonic and hydrologic history with diagenetic evolution to predict sandstone porosity. The list below outlines steps for predicting porosity from burial history and is illustrated in Figure 5.
- Construct a burial history diagram for the formation of interest in the prospect area.
- Plot the tectonic history of the basin in the prospect area along the lower x-axis.
- Plot the hydrologic history of the prospect area along the lower x-axis. Use the tectonic history to infer the hydrologic history of the prospect.
- Plot the porosity curve by combining concepts of diagenetic processes with burial and hydrologic histories of the prospect.
Example of using burial history
Figure 5 is an example of a diagram showing diagenetic and burial history for the Brent Group Sandstones, North Sea. Line thicknesses indicate relative abundance of diagenetic components.
Figure 6 is an example of sandstone porosity prediction using burial history.
Analog porosity
Analog porosity values for different depositional environments can help us predict the porosity of reservoir system rocks when the target formation is unsampled within the basin. Analog values, however, may have wide ranges within facies and subfacies of depositional environments. Therefore, we should use care when applying analog data.
See also
- Predicting sandstone porosity and permeability
- Sandstone diagenetic processes
- Effect of composition and texture on sandstone diagenesis
- Hydrology and sandstone diagenesis
- Influence of depositional environment on sandstone diagenesis
- Predicting sandstone permeability from texture
- Estimating sandstone permeability from cuttings
References
- ↑ Loucks, R. G., M. M. Dodge, and W. E. Galloway, 1984, Regional controls on diagenesis and reservoir quality in Lower Tertiary sandstones along the Texas Gulf Coast, in D. A. McDonald and R. C. Surdam, eds., Clastic Diagenesis: AAPG Memoir 37, p. 15–45.
- ↑ 2.0 2.1 Scherer, M., 1987, Parameters influencing porosity in sandstones: a model for sandstone porosity prediction: AAPG Bulletin, vol. 71, no. 5, p. 485–491.
- ↑ 3.0 3.1 3.2 Surdam, R. C., T. L. Dunn, D. B. MacGowan, and H. P. Heasler, 1989, Conceptual models for the prediction of porosity evolution with an example from the Frontier Sandstone, Bighorn basin, Wyoming, in E. B. Coalson, S. S. Kaplan, C. W. Keighin, L. A. Oglesby, and J. W. Robinson, eds., Sandstone Reservoirs: Rocky Mountain Association of Geologists, p. 7–21.
- ↑ Wilson, M. D., 1994, Assessing the relative importance of diagenetic processes and controls, in M. D. Wilson, ed., Reservoir Quality Assessment and Prediction in Clastic Rocks: SEPM Short Course 30, p. 259–276.
- ↑ Hayes, J. B., 1983, Sandstone diagenesis as an exploration tool: AAPG Clastic Diagenesis School, June 27–July 1, Monterey, California.
External links
| find literature about Predicting sandstone reservoir porosity |