Production logging
After casing is set in place, wireline surveys are often run to evaluate the integrity of the completion. Such surveys include production logs and mechanical integrity instruments. Production logs are used to evaluate fluid production and movement both inside and outside of the casing downhole. The production logging tools are small in diameter and are run through tubing for evaluation of the well as it is producing. Mechanical integrity instruments, which assess the condition of the casing or cement around it, are generally larger in diameter. These surveys are run before the tubing is in place, or else it must be removed and the well shut-in.
Production logs
The main applications of the production logs include
- Locating sources downhole of undesired fluid phase production such as water entries
- Isolating mechanical problems such as leaking pipes, leaking packers, and fluid movement in cement channels behind pipe
- Evaluating the effectiveness of well treatment or workover operations by comparing the before and after job surveys
- Accumulating baseline well performance information for comparison with later monitor surveys
- In EOR projects, maintaining injection efficiency by evaluating the injection profiles of individual wells in a field
Production logs include (1) those designed to detect flow in and around pipes (temperature, noise, radioactive tracer, flowmeter, and fluid identification logs) and (2) those designed to evaluate flow quantitatively. Often combinations of these logs are required to be effective.[1][2][3]
Flow detection in and around pipe
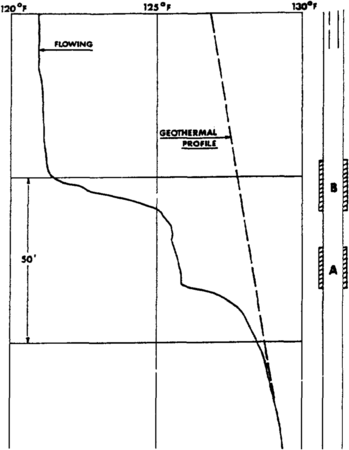
Figure 1 Temperature survey showing two gas entries and the geothermal gradient.
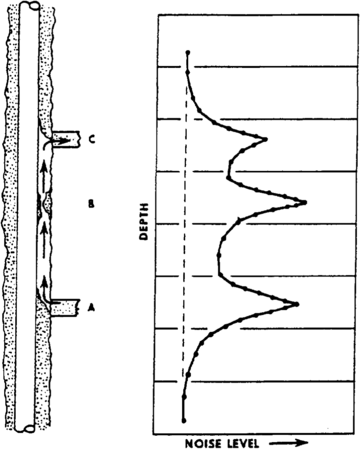
Figure 2 Noise log responses to fluid movement downhole.
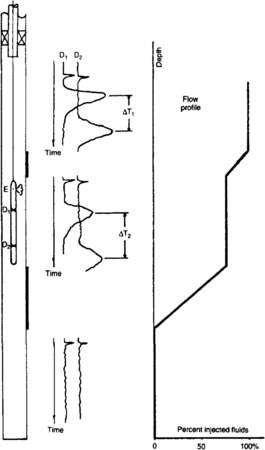
Figure 3 Tracer velocity shot technique and injection profile.


Temperature surveys are the most common surveys to locate fluid movement downhole. Small entries and even flow in channels behind pipe can be detected. Generally, if a well is not flowing, the temperature of the fluid in the borehole will eventually approach the formation temperature, called the geothermal gradient. When a well is produced, formation fluids enter the borehole and move uphole. Gasses typically cool when entering the borehole while liquids do not. In either case, their movement uphole is easily detected by deviations of the borehole temperature from the geothermal gradient. Figure 1 illustrates a typical temperature survey response to two gas entries into a well.
Noise logs are also used to evaluate fluid movement downhole. Unlike temperature surveys, noise logs are not run continuously across the interval of interest. Instead, a number of stationary readings are taken at different depths downhole. The movement of fluids, especially gasses, generates turbulence or noise, which gets louder as the flow rate or pressure drop increases. Figure 2 shows how a noise log can be effective at detecting movement downhole. In this schematic diagram, a source, sink, and restriction to flow are the noise sources. The frequency spectrum of the noise is also observed to further improve the understanding of flow downhole.
Radioactive tracer surveys use a tool composed of an ejector capable of ejecting shots of radioactive tracer material into the flow stream, usually of an injection well. Such an instrument has either one or two gamma ray detectors spaced below the ejector. By various techniques, the operator chases the ejected radioactive material as it moves with the injected fluid. By noting the position, time, and size of the tracer signal, an accurate overview of the injection profile can be established. Special techniques are also available to detect injected fluid channeling through the cement to undesirable zones. A schematic diagram of a tracer tool is shown in Figure 3.
Quantitative flow evaluation
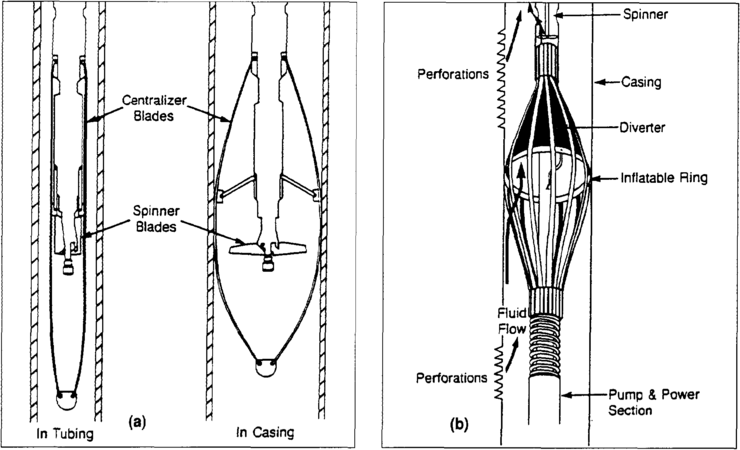
Figure 4 Two types of flowmeters, (a) Full bore flowmeter, (b) Diverting basket type flowmeter.
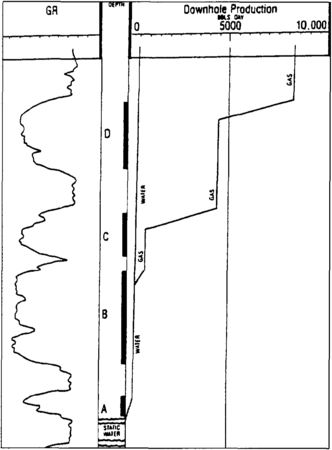
Figure 5 Row profile in a producing well.


Quantitative evaluation of flow profiles in injection or producing wells is common. Injection wells are most often evaluated with radioactive tracer techniques, while producing wells, where multiphase flow may be encountered, are evaluated using flowmeters with fluid identification devices.
The most effective technique with radioactive tracers is the velocity shot technique, illustrated in Figure 3. The tool is stationary during such a test, and the gamma count rate is recorded at the surface. In Figure 3, tests were made above, between, and below the perforations, and the surface recordings are shown to the right of the well sketch. The highest velocity and flow rate are recorded above the perforations, while zero flow is detected in the lowest interval. By measurement of the traveltime between detectors, Δt, and using the known spacing between detectors D1 and D2, the flow rates can be calculated and an injection profile constructed, as shown on the right of the figure.
In producing wells, spinner flowmeters are used to measure the bulk flow rate, even in multiphase flow conditions.[4] Two such flowmeters are shown in Figure 4. The full bore flowmeter in Figure 4(a) is run continously across the interval of interest, while the basket type flowmeter in Figure 4(b) uses stationary measurements. Although these devices can determine the bulk flow rate, fluid identification tools are required to evaluate the kinds of fluids present in the flow. These fluid identification instruments measure the pressure gradient, bulk density, or capacitance of the flowing mixture. The flowmeter and fluid identification devices are usually run as a combination on the same tool string. Results typical of such a tool string are shown in Figure 5. In this example, zone A produces water, while the zones above it are all gas producers. A plug set between zones A and B will be effective at eliminating the water production in this example.
Mechanical integrity logs
The well mechanical integrity survey logs include two groups. The first group, cement evaluation surveys, assesses the degree of cement fill around the casing and can be effective at locating potential channels for fluid movement. The second group is the casing inspection surveys, in which acoustic, mechanical, and electromagnetic measurements are used to evaluate internal and external casing conditions.
Cement evaluation
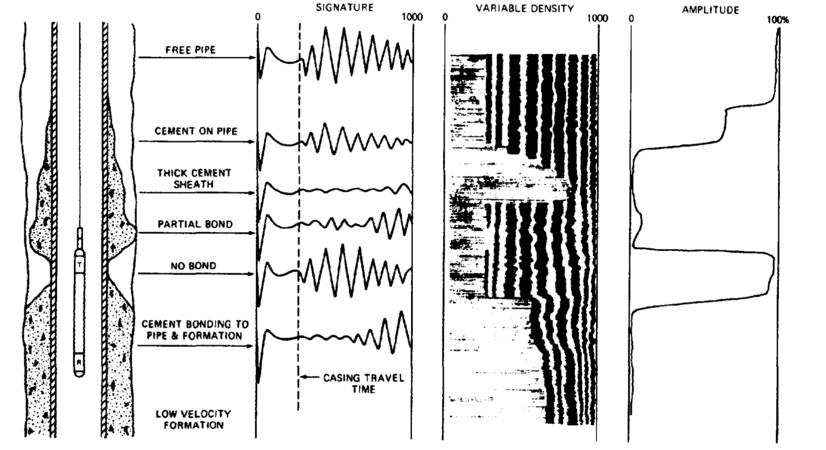
Figure 6 CBL logs and their response to various cement conditions.
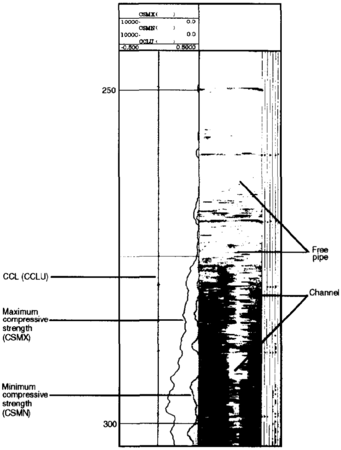
Figure 7 Pulse-echo cement bond log showing cement top and channel on the cement map presentations.


Cement evaluations are primarily done with cement bond logs or pulse-echo cement evaluation tools. These are acoustic devices whose main objectives are the measurement of cement annular fill around the casing.
The cement bond log (CBL) measures the degree to which cement contacting the pipe on the outside attenuates an acoustic signal traveling along the pipe.[5][6][7] Figure 6 illustrates how the acoustic signal is affected by the presence of cement. The initial portion of the acoustic signal or signature indicates the amplitute of the signal traveling along the pipe. The a mplitude curve records the amplitude of this initial portion or pipe signal. A low amplitude indicates good bond, while a very high signal amplitude shows free pipe. This amplitude measurement can be converted to percent annular fill of cement. The variable density log (VDL) at the far right of Figure 6 is a contour map of the received wavetrain signature as it changes with depth.
The pulse-echo cement bond log (CET) operates in an entirely different acoustic mode than does the CBL.[8] The pulse-echo tool is effective at measuring the compressive strength of cement behind pipe, as well as detecting the presence of liquid or gas behind pipe. The main presentation of the pulse-echo tool is the cement map shown on the right of Figure 7. The dark areas correspond to cement, and the white areas indicate the lack of it. With such a cement map, likely channels can be readily detected.
Casing inspection
The pulse-echo tool is also an effective acoustic casing inspection device, providing such information as internal diameter and wall thickness. Mechanical calipers, having 40 to 80 feelers, are excellent at inspecting the inside of the casing for small- or large-scale damage. Electromagnetic devices are useful in inspecting for pipe damage on either the inside or outside of the casing and can be useful in examining the outer concentric strings of pipe.
See also
References
- ↑ Schlumberger, 1989, Cased hole log interpretation principles/applications: Houston, TX, Schlumberger Educational Services, Document No. SMP-7025.
- ↑ Atlas Wireline Services, 1986, Interpretative methods for production well logs, 3rd ed.: Houston, TX, Document No. 9441.
- ↑ Society of Petroleum Engineers, 1985, Production logging: Richardson, TX, SPE Reprint Series No. 19.
- ↑ Anderson, R. A., J. J. Smolen, L. Laverdiere, and J. A. Davis, 1980, A production logging tool with simultaneous measurements: Journal of Petroleum Technology, February, p. 191–198.
- ↑ Pardue, G. H., R. L. Morris, L. H. Gollwitzer, and J. H. Moran, 1963, Cement bond log—a study of cement and casing variables: Journal of Petroleum Technology, May.
- ↑ Fitzgerald, D. D., B. F. McGhee, and J. A. McGuire, 1983, Guidelines for 90% accuracy in zone isolation decisions: Richardson, TX, Society of Petroleum Engineers, SPE 12141.
- ↑ Western Atlas International, 1985, Acoustic Cement Bond Log and Prolog CBL: Houston, TX, n. 2206.
- ↑ Froelich, B., A. Dumont, D. Pittman, and B. Seeman, 1982, Cement evaluation tool—a new approach to cement evaluation: Journal of Petroleum Technology, August.
External links
| find literature about Production logging |