Quantitative paleoenvironmental analysis
| Exploring for Oil and Gas Traps | |

| |
| Series | Treatise in Petroleum Geology |
|---|---|
| Part | Predicting the occurrence of oil and gas traps |
| Chapter | Applied paleontology |
| Author | Robert L. Fleisher, H. Richard Lane |
| Link | Web page |
| Store | AAPG Store |
Benthic foraminifera have been used as paleoenvironmental indicators in the petroleum industry for forty years—most particularly as a basis for subjective estimates of paleobathymetry based on the presumed water depth range of species in the samples. Recent studies have shown that computer-based quantitative techniques such as clustering, principal component analysis, and discriminant analysis result in the following advantages:
- Permit the use of large data sets
- Increase the objectivity, reliability, and reproducibility of interpretations
- Clarify the definition of significant assemblages
Cluster analysis
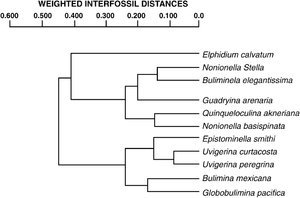
One of the most popular methods of recognizing biofacies assemblages is cluster analysis. This method arranges the species into a hierarchical classification called a dendrogram. Dendrograms are constructed from the statistical distance or similarity between samples, based on their species composition. The species having the highest degree of similarity are clustered first, then others in successive order, until all species are paired into clusters. The results of the cluster analysis show faunal groupings, or biofacies, which are often characteristic of specific environments. Figure 1 is an example of weighted interfossil distances for Neogene benthic foraminifera of offshore California.
Principal component analysis
The patterns, or factor plots, displayed in principal component analysis represent groupings of species based on the similarity or dissimilarity of their distribution. These groupings may represent various environments and can be integrated with other geologic data to determine or evaluate specific paleoenvironmental zones or settings.
Discriminant analysis
In discriminant analysis, paleoenvironmental zones are established and then tested against known environmental models to check the level of reliability in recognizing these biofacies. The results indicate which biofacies are distinct and statistically recognizable. The biofacies so determined can be used to interpret the paleoenvironment of well sections, cores, or outcrop sections.
See also
- Applications of biostratigraphy
- Biostratigraphic correlation and age determination
- Paleoenvironmental analysis
- Paleobathymetry
- Palynofacies and kerogen analysis
- Thermal maturation
- Biostratigraphy in sequence stratigraphy
