Three-dimensional seismic method
| Development Geology Reference Manual | |

| |
| Series | Methods in Exploration |
|---|---|
| Part | Geophysical methods |
| Chapter | Three-dimensional seismic method |
| Author | Öz Yilmaz |
| Link | Web page |
| Store | AAPG Store |
Subsurface geological features of interest in hydrocarbon exploration are three-dimensional (3-D) in nature. Examples are salt diapirs, overthrust and folded belts, major unconformities, reefs, and deltaic sands. A two-dimensional (2-D) seismic section is a cross section of a 3-D seismic response. Despite the fact that a 2-D section contains signal from all directions, including out-of-plane of the profile, 2-D migration normally assumes that all of the signal comes from the plane of the profile itself. Although out-of-plane seismic signals (sideswipes) are often recognizable by the experienced seismic interpreter, the sideswipe signal causes 2-D migrated sections to mistie. These misties are due to inadequate imaging of the subsurface resulting from the use of 2-D rather than 3-D migration[1] (see Seismic data - mapping with two-dimensional data).
Performing 3-D surveys
A typical marine 3-D survey is carried out by shooting closely spaced parallel lines (line shooting). A typical land or shallow water 3-D survey is done by laying out a number of receiver lines parallel to one another and placing the shot points in the perpendicular direction (swath shooting). Other recording geometries have also been used in acquiring 3-D data. Shooting in circles has been done in the Gulf of Mexico to delineate salt domes. Shooting around a lake or a topographic high to achieve subsurface coverage under the surface obstacle has also been tried.
In marine 3-D surveys, the shooting direction (boat track) is considered to be the in-line direction, whereas in land 3-D surveys, the receiver cable is along the in-line direction. The direction that is perpendicular to the in-line direction in a 3-D survey is called the cross-line direction. In contrast to 2-D surveys in which line spacing can be as much as length::1 km, the line spacing in 3-D surveys can be length::50 m or less. This dense coverage requires an accurate knowledge of shot and receiver locations.
The size of the survey area is dictated by the areal extent of the subsurface target zone and the aperture size required for adequate imaging of that target zone.[2] This imaging requirement means that the areal extent of a 3-D survey almost always is larger than the areal extent of the objective. A few hundred thousand to a few hundred million traces normally are collected during a 3-D survey.
Processing of 3-D data
The basic principles of 2-D seismic data processing still apply to 3-D processing. In 2-D processing, traces are collected as common midpoint (CMP) gathers, while in 3-D processing, traces are collected as common-cell gathers (bins). These gathers are used in velocity analysis, and common-cell stacks are generated. Typical cell sizes are 25 by length::25 m for land surveys and 12.5 by depth::37.5 m for marine surveys.
Conventional 3-D recording geometries often complicate the process of stacking the data in a common-cell gather. Cable feathering in marine 3-D surveys can result in traveltime deviations from a single hyperbolic moveout within a common-cell gather. For land 3-D surveys, azimuth-dependent moveout within a common cell gather is an issue.
After stacking, the 3-D data volume is sometimes (but not always) migrated in two stages. First, a 2-D migration is applied along the in-line or cross-line direction. Then the data are sorted, and a second pass of 2-D migration is applied along the orthogonal direction. Before the second pass of migration, the data sometimes need to be trace interpolated along the cross-line direction to avoid spatial aliasing.
3-D versus 2-D migration
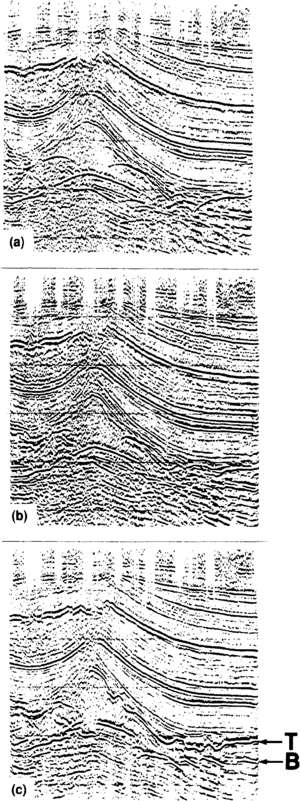
Three-dimensional migration often produces surprisingly different sections from 2-D migrated sections (see Seismic migration). The example in Figure 1 shows a no reflection zone on the 2-D migrated section, while the same zone contains a series of continuous reflections on the 3-D migrated section that are easily correlated with reflections outside that zone. When we do 2-D migration, we confine the movement of the energy into the plane of the line itself. So the energy contained in the unmigrated stacked section in Figure 1a is indeed the same as the energy contained in the 2-D migrated section in Figure 1b, except that it has been moved somewhere else on the section. As a result of moving the energy during 3-D migration within the 3-D volume, some energy moved into the section (Figure 1c) from others and some moved out of the section and migrated into the others.
From the field data example, we see that 3-D migration provides complete imaging of the 3-D subsurface geology. Specifically, 2-D migration cannot adequately image the subsurface and introduces misties between 2-D lines in the presence of dipping events. However, 3-D migration eliminates these misties by completing the imaging process.
The difference between 2-D and 3-D seismic methods is the way in which migration is performed. Just having a dense coverage on top of a target zone, for example, a 25-m in-line trace spacing and a 25-m cross-line trace spacing, will not necessarily provide adequate subsurface imaging unless migration is performed in a 3-D sense. But one does need the dense coverage to perform the 3-D migration accurately. Also, to be able to map small subsurface features, sufficiently close spatial sampling is needed.
3-D interpretation
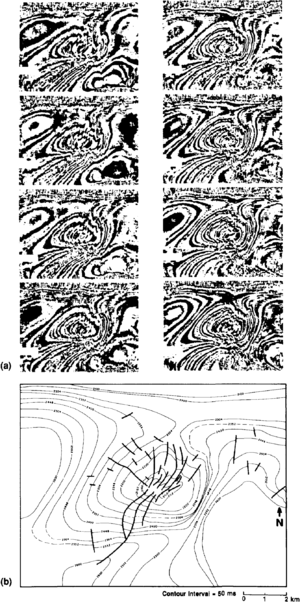
The 3-D data volume is available to the interpreter as vertical sections in both the in-line and cross-line directions and as horizontal sections (time slices). The time slices allow the interpreter to generate contour maps for marker horizons (Figure 2). The interactive environment provides an effective and efficient means for interpretation of the sheer volume of 3-D migrated seismic data. Fault correlations, horizon tracking, horizon flattening, and some image processing techniques can be adapted to the interactive environment to help improve interpretation. Since the 3-D volume provides detailed constraints on interpretational decisions, drilling programs based on 3-D seismic usually have high success rates.
See also
- Seismic interpretation
- Seismic data - mapping with two-dimensional data
- Synthetic seismogram
- Vertical and lateral seismic resolution and attenuation
- Forward modeling of seismic data
- Displaying seismic data
References
- ↑ French, W. S., 1974, Two-dimensional and three-dimensional migration of model-experiment reflection profiles: Geophysics, 39, 265–277. DOI:10.1190/1.1440426
- ↑ Yilmaz, O., 1987 Seismic Data Processing: Society of Exploration Geophysicists, Tulsa, OK, 525 p

