Van Krevelen diagram
Jump to navigation
Jump to search
The printable version is no longer supported and may have rendering errors. Please update your browser bookmarks and please use the default browser print function instead.

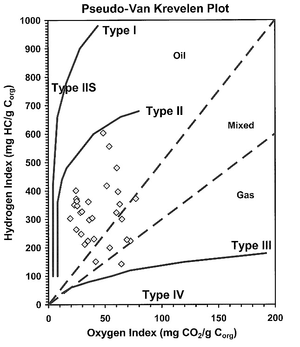
Van Krevelen diagram.[1]
A plot of atomic oxygen/carbon (O/C) versus atomic hydrogen/carbon (H/C) originally used to classify coals and predict compositional evolution during thermal maturation, but adapted to classify kerogen types I, II, III, and IV. More common is the pseudo-Van Krevelen diagram, where Rock-Eval pyrolysis oxygen index ([OI] mg HC/g TOC) is plotted versus hydrogen index ([HI] mg HC/g TOC).[2]
This article is a stub. You can help AAPG Wiki by expanding it.
References
- ↑ Dembicki, H., 2009, Three common source rock evaluation errors made by geologists during prospect or play appraisals: AAPG Bulletin, vol. 93, issue 3, pp. 341-356.
- ↑ Peters, Kenneth E., David J. Curry, and Marek Kacewicz, 2012, An overview of basin and petroleum system modeling: Definitions and concepts, in Peters, Kenneth E., David J. Curry, and Marek Kacewicz, eds., Basin modeling: New horizons in research and applications: AAPG Hedberg Series no. 4, p. 1-16.