Wettability
| Development Geology Reference Manual | |

| |
| Series | Methods in Exploration |
|---|---|
| Part | Laboratory methods |
| Chapter | Wettability |
| Author | Jim Funk |
| Link | Web page |
| Store | AAPG Store |
Wettability significantly affects a variety of measurements critical to describing oil reservoirs, from residual saturations to resistivity indices. In spite of the importance attributed to wettability, no standardized technique exists that completely and adequately characterizes the phenomenon. The most complete review of the subject is given by Anderson.[1] [2]
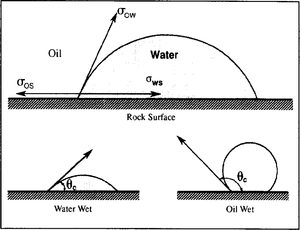
Physically, wettability represents a balance of forces that occur at the interface between three phases, one of which is a solid. The equation describing this balance was first developed by Young in 1805.[3] For an oil, water, and solid system, the equation would be
where
- σos = interfacial energy between oil and solid
- σws = interfacial energy between water and solid
- σow, = interfacial tension between oil and water
- θC = contact angle
Wettability is determined in three ways:
- Measurement of the contact angle, or the product of the contact angle and the interfacial tension (the last term in Young's equation)
- Measurement of the relative amounts of oil and water displaced under similar conditions
- Observations of displacement or surface phenomena associated with the water or oil phase
The first method is the most difficult, while the second is the most common. The third is the most varied in terms of methods and results.
Techniques[edit]

Contact angle measurements[edit]
If a liquid wets a surface, it tends to spread and cover that surface. Observed on a microscopic scale, the edge of the liquid has a characteristic shape. A knife edge shape indicates wetting, while a beaded edge shape indicates nonwetting. This is shown quantitatively in Figure 1, which shows a drop of water surrounded by oil and contacting a solid surface. If the edge of the drop forms an acute angle (θe 5.) Several techniques used to measure this angle are described by Adamson.[3] The measurements are generally made on a polished surface that simulates the reservoir material. For sandstones, glass slides or polished quartz are often used. Polished marble is usually chosen to simulate a carbonate reservoir. An adaptation of the technique uses a drop of liquid confined between two surfaces.[5]
Contact angle measurements can be precise, but even for ideal systems, measurements can show significant variation. Variations are related to surface preparation, equilibration of the solid and liquids, and surface roughness.
Utilization of a surface balance provides information on the product of the interfacial tension and the contact angle.[6] This technique is quantitative and flexible but subject to some of the same limitations as those of contact angle measurements.
Displacement techniques[edit]
Measurements that use larger samples are usually employed for reservoir materials that show varying composition, mineralogy, and structure. Two procedures most commonly used are the Amott[7] and the U.S. Bureau of Mines (USBM) method.[8]
Amott method[edit]
The Amott method uses four basic measurements:
- Amount of oil spontaneously imbibed
- Amount of oil forcibly imbibed
- Amount of brine spontaneously imbibed
- Amount of brine forcibly imbibed.
For spontaneous processes, the sample is submerged in the fluid to be imbibed and the displaced volume of nonimbibed fluid is measured. The forced processes involve either centrifuging the sample in the imbibing fluid or flowing the imbibing fluid through the sample and measuring the volume of the nonimbibed fluid displaced.
The displacement volumes (both spontaneous and total) are measured for both oil and water. The ratio of the spontaneously displaced volume to the total displaced volume is calculated for both the oil and the brine phases.
If a sample spontaneously imbibes only brine, it is considered water wet. Similarly, if it imbibes only oil, it is considered oil wet. If the sample imbibes neither, it is described as neutrally wet.
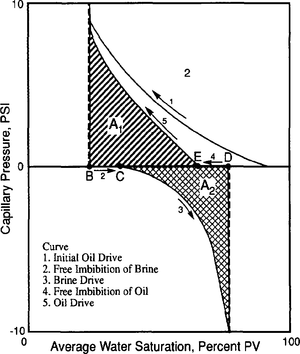
A modification of the test in general use first prepares the sample by centrifuging it in brine. This is followed by centrifuging in oil to irreducible water saturation. The Amott procedure is then followed, but a combined index—the Amott-Harvey wettability index[9] is calculated by subtracting the displacement by oil ratio from the displacement by water ratio. Figure 2 shows these volumes, and Equation 2 gives the calculation:
The range of values and the corresponding wettability characteristics are listed in Table 1.
| Water Wet | Neutrally Wet | Oil Wet | |
|---|---|---|---|
| Contact angle | |||
| Minimum | 0° | 60 to 75° | 105 to 120° |
| Maximum | 60 to 75° | 105 to 120° | 180° |
| USBM wettability index | W near 1 | W near 0 | W near -1 |
| Amott wettability index | |||
| Displacement by water ratio | Positive | Zero | Zero |
| Displacement by oil ratio | Zero | Zero | Positive |
| Amott-Harvey wettability index | 0.3 to 1.0 | –0.3 to 0.3 | –1.0 to –0.3 |
USBM method[edit]
The USBM method developed by Donaldson et al.[8] uses the same types of data, but considers the work required to do the forced displacement. This requires calculating the area under the capillary pressure curve obtained during the forced displacement. Generally, the capillary pressure displacement is done by centrifuging, but other capillary displacement techniques can be used.
Wettability (W) of the sample is determined by comparing the log of the area (A1) under the oil-displacing brine curve with the log of the area (A2) under the brine-displacing oil curve. The USBM index is defined by the following equation:
The Amott and the USBM methods can be combined into a single test.[11] This combination and the capillary pressure plot used in the USBM calculation, are shown in Figure 2.
Comparison of the two methods[edit]
Both the Amott and the USBM test are commonly used in the oil industry, but direct comparisons of the two techniques show only minimal correlation.[12] The most significant deviations occur near the neutral wettability region. The Amott method is more sensitive in this area and may be a better indicator. The Amott method can also be used to indicate mixed wettability if a sample spontaneously imbibes both oil and water.
Additional techniques[edit]
Several techniques are described in the literature for determining wettability.[10] Some are modifications of the Amott or the USBM methods, while others represent significant departures from the standard techniques. These vary from microscopic examination of imbibed fluids to measurement of nuclear magnetic resonance (NMR) longitudinal relaxation. Table 2 lists some of these techniques and their observed variables.
| Method | Observation |
|---|---|
| Microscopic examination | Visual examination of the fluid surrounding grains |
| Flotation method | Distribution of grains at water/oil interface or air/water interface |
| Glass slide method | Displacement of the nonwetting fluid from a glass slide |
| Relative permeability method | Location and relative magnitudes of kro and krw curves |
| Reservoir logs | Resistivity logs before and after injection of a reverse wetting agent |
| Nuclear magnetic resonance | Changes in the longitudinal relaxation time |
| Dye adsorption | Adsorption of a water soluble dye |
See also[edit]
- Core description
- Porosity
- Introduction to laboratory methods
- Relative permeability and pore type
- Paleontology
- Oil and condensate analysis
- Capillary pressure
- Oilfield water analysis
- Permeability
- SEM, XRD, CL, and XF methods
- Thin section analysis
- Rock-water reaction: formation damage
- Overview of routine core analysis
- Core-log transformations and porosity-permeability relationships
References[edit]
- ↑ Anderson, W. G., 1986a, Wettability literature survey—Part 1, Rock/oil/brine interactions and the effects of core handling on wettability: Journal of Petroleum Technology, v. 38, p. 1125–1144., 10., 2118/13932-PA
- ↑ Anderson, W. G., 1986f, Wettability literature survey—Part 6, Effects of wettability on waterflooding: Journal of Petroleum Technology, v. 38, p. 1605–1622.
- ↑ 3.0 3.1 Adamson, A. W., 1982, Physical Chemistry of Surfaces, 4th ed.: New York, John Wiley and Sons.
- ↑ Raza, S. H., Treiber, L. E., Archer, D. L., 1968, Wettability of reservoir rocks and its evolution: Producers Monthly, v. 32, p. 2–7.
- ↑ Craig, F. F., 1971, The reservoir engineering aspects of waterflooding: Dallas, TX, Society of Petroleum Engineers Monograph No. 3, 120 p.
- ↑ Teeters, D., Anderson, M. A., Thomas, D. C., 1989, Formation wettability studies that incorporate the Wilhelmy plate technique, in Borchardt, J. K., Yen, T. F., eds., Enhanced and Production Stimulation: Washington, D., C., American Chemical Society Symposium Series No. 396.
- ↑ Amott, E., 1959, Observations relating to the wettability of porous rock: Petroleum Transactions, AIME, v. 216, p. 156–162.
- ↑ 8.0 8.1 Donaldson, E. C., Thomas, R. D., Lorenz, P. B., 1969, Wettability determination and its effect on recovery efficiency: Society of Petroleum Engineers Journal, v. 9, p. 13–20., 10., 2118/2338-PA
- ↑ Boneau, D. F., Clempett, R. L., 1977, A surfactant system for the oil wet sandstone of the North Burbank unit: Journal of Petroleum Technology, v. 29, p. 501–506., 10., 2118/5820-PA
- ↑ 10.0 10.1 Anderson, W. G., 1986b, Wettability literature survey—Part 2, Wettability measurements: Journal of Petroleum Technology, v. 38, p. 1246–1262., 10., 2118/13933-PA
- ↑ 11.0 11.1 Shamra, M. M., Wundlerlich, R. W., 1985, The alteration of rock properties due to interactions with drilling fluid components: Annual Technical Conference and Exhibition of the Society of Petroleum Engineers, Las Vegas, NV, Sept. 22–25, SPE 14302.
- ↑ Crocker, M. E., Marchin, L. M., 1986, Evaluation and determination of cross correlations between wettability methods—Status Report Project BE7: Bartlesville, OK, National Institute for Petroleum Energy and Research.


