Wireline formation testers
| Development Geology Reference Manual | |

| |
| Series | Methods in Exploration |
|---|---|
| Part | Wireline methods |
| Chapter | Wireline formation testers |
| Author | James J. Smolen |
| Link | Web page |
| Store | AAPG Store |
Formation testers are a class of wireline tools used to measure the downhole pressure of formations. Stationary measurements of formation pressure in an open hole are made at any number of depths during a single trip into the hole. These pressure measurements are useful in determining
- variations in pressure among various formations,
- gradients of fluid pressure within a formation that can indicate fluid content,
- gas-oil or water-oil contacts, and
- local permeability.
Comparison with initial reservoir pressures in development wells may indicate zonal pressure depletion. Formation testers are also used to retrieve samples containing fluids.
Operation of the tools
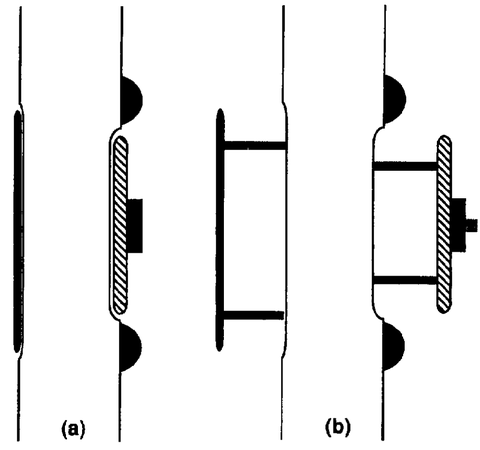
Figure 1 Wireline formation tester. (a) Retracted configuration (tool closed). (b) Set configuration (tool set).
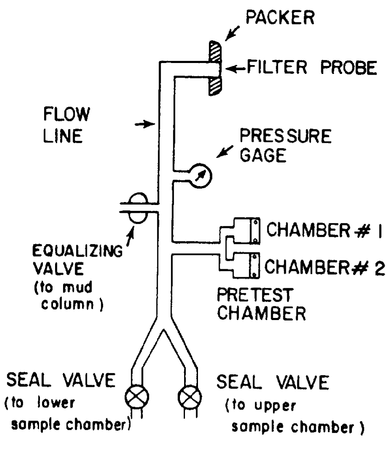
Figure 2 Dual pretest formation tester sampling system.[1]


When the tool is being moved downhole, the formation tester is in its retracted configuration. When a depth is selected for a pressure measurement, the formation tester is activated and hydraulically set or pressed against the formation. These conditions are shown schematically in Figure 1.
Two modes of measurement exist: (1) a pretest measurement in which formation pressures are examined and (2) a fluid sample measurement in which formation fluids are physically withdrawn and retrieved to the surface for examination. The sequence of tool movements required to measure formation pressure begins when the formation tester is activated at a selected depth. The sampling system shown in Figure 2 illustrates how this measurement is made. Prior to activating the tool, the pressure gauge measures hydrostatic mud column pressure. Upon activation, the equalizing valve is shut and the packer and probe are pushed against the formation. The tool is now set. Within a few seconds, the pistons of the pretest chambers begin to withdraw, causing fluid from the formation to flow into the tool through the packer and probe assembly. The pretests are done sequentially with a small volume (typically 10 cc) of fluid drawn into chamber #1 over about 15 sec, followed by a similar volume flowing into chamber #2 at a higher flow rate. Upon completion of the pretests, a sample can be taken or the tool can be retracted. During retraction, the equalizing valve is opened and the pretest pistons expel the fluid taken in. The tool is now ready for the next test depth. Different vendors may use variations of this design that incorporate a single pretest chamber of fixed or variable volume.
Pressure measurement
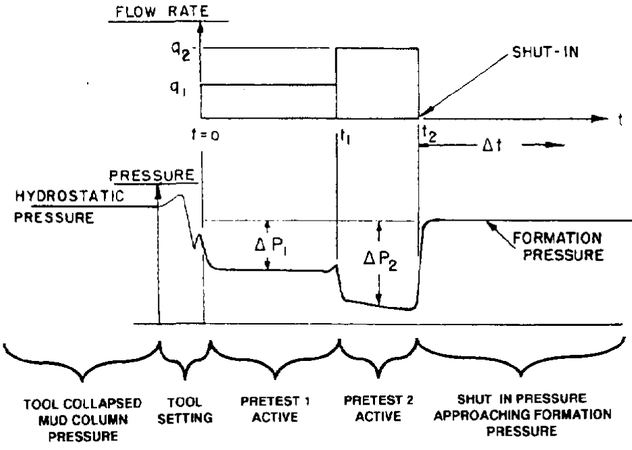
Figure 3 Pressure recording by a dual pretest formation tester.[1]
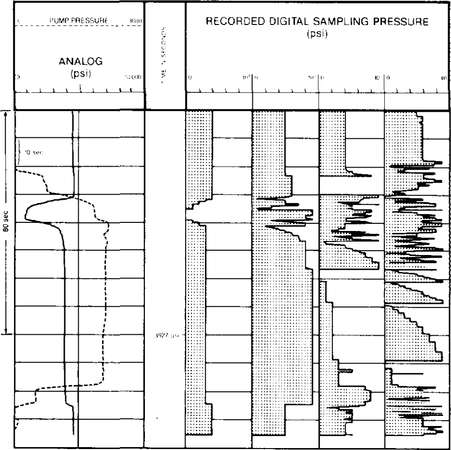
Figure 4 Typical log record of a single pretest formation tester showing both analog and digital log presentations. Copyright: Western Atlas International, 1987; courtesy of Atlas Wireline Services Division of Western Atlas International, Inc.
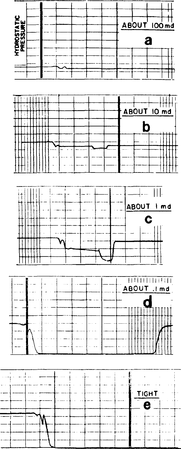
Figure 5 Pretest pressure response to formation permeability as measured by a dual pretest tool.[1]


During the pretest sequence, pressure is monitored with the tool sampling system. The schematic drawing in Figure 3 shows the pressure typically recorded during the pretest sequence. In this figure, time is shown as increasing to the right and pressure and flow rate are increasing upward. Initially, and when the tool is being set, the equalizing valve is open and the recorded pressure is hydrostatic mud column pressure. During the drawdown associated with the first pretest, the pressure is observed to drop, stabilize, and further decrease during the second pretest.
When the second pretest is completed, the flow stops and the pressure builds up to formation pressure. Figure 3 illustrates the flow rates associated with the first and second pretests. Actual formation pressure can be taken when the pressure becomes stable or can be estimated from the character of the buildup if it has not yet stabilized when the tool is retracted.
Figure 4 is a typical log recorded by a formation tester that has a single pretest chamber. In the left log track, the solid curve represents the pressure detected by the gauge within the tool sampling system. Time is increasing downward along the log. The hydrostatic mud column, drawdown, and formation pressures are clearly detectable. The sudden increase at about 105 sec corresponds to the tool retraction and opening of the equalizing valve. On the right are four narrow tracks displaying the thousands, hundreds, tens, and units digit of the measured pressure. For example, after 80 sec, the formation pressure is 3927 psi. It is obvious on the units track that the pressure is increasing and actual formation pressure has not yet been reached.
Formation permeability
Formation permeability has a significant effect on the drawdown response during a pretest. The pretest pressure recordings shown in Figure 5 illustrate typical records for sandstones at 0.1, 1, 10, and 100 mD (millidarcys). While these figures are qualitative, quantitative techniques exist for estimating permeability using both the pressure drawdown and buildup characteristics of the pretest or sample test.
Pressure applications
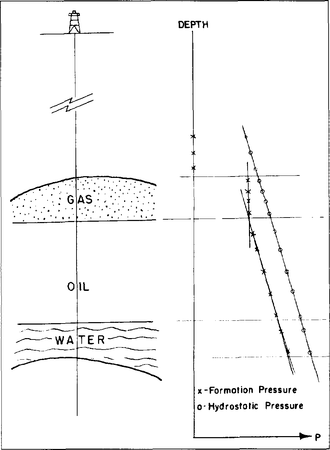
Figure 6 Pretest pressure response measurements across a reservoir. Copyright: Schlumberger Well Services, 1981.
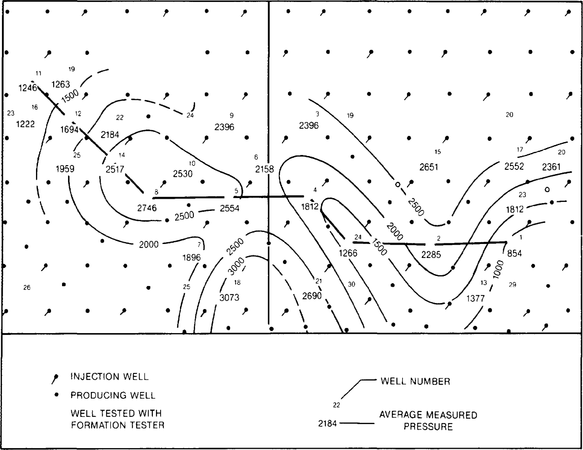
Figure 7 Pressure contour map in zone of water injection. Copyright: Western Atlas International, 1987; courtesy of Atlas Wireline Services Division of Western Atlas International, Inc.


Although formation testers can take samples, they are often run solely for the pressure information available from the pretest. Figure 6 shows how such pretest data can be useful. In this figure, the well is shown penetrating a reservoir that has gas, oil, and water intervals. The formation tester is set at numerous depth intervals across this reservoir. The formation pressure recorded by the tool is indicated by an “x,” while the hydrostatic mud column pressure is indicated by an “o.” The degree of overbalance (that is, the difference between the mud and formation pressures) is clearly visible from the schematic. The fluid gradients are also detectable, and the gas column is readily distinguished from the oil, which is also distinguishable from the water. The location of the gas-oil and water-oil contacts can also be determined from the formation pressure profile.
After a reservoir has been produced, some pressure decline can be expected. Formation testers are frequently run in development or in-fill wells. When compared to initial reservoir pressures, pressure profiles in these wells often show that certain zones may have produced more than neighboring zones, thereby indicating the presence of permeability barriers.
Pressures in zones of injection have also been monitored using the Formation tester. Such a case is shown in Figure 7. In this example, 22 wells were drilled some years after water flooding was begun in a reservoir. Formation tester pressure data from these 22 wells were used to plot a contour map of the formation pressure. This map clearly shows high pressure ridges associated with the banks of injection wells and troughs associated with the producing wells.
Fluid sampling
Based on the ability of the fluid to freely fill the pretest chamber, a larger sample of formation fluid can be taken for analysis on the surface. The larger samples can range from 1 to 10 gal or more. Due to mud filtrate invasion, a large fraction (if not all) of the retrieved fluid may be mud filtrate. Proper analysis of the sample involves discriminating the filtrate from the native formation fluids.
Measurements of water resistivity, API gravity, gas to oil ratio, and water chemistry can be performed at the wellsite with prior planning with the vendor. Formation fluid samples can also be maintained at formation pressures and shipped to laboratories for detailed analysis. However, shipment of pressurized samples may require use of special vessels approved by the Department of Transportation, and prior arrangements should be made with the involved vendors.
See also
- Basic open hole tools
- Basic tool table
- Formation evaluation of naturally fractured reservoirs
- Quick-look lithology from logs
- Determining formation fluid pressure from repeat formation testers (RFTs)
References
External links
| find literature about Wireline formation testers |