East Breaks hydrocarbon accumulation model
| Exploring for Oil and Gas Traps | |

| |
| Series | Treatise in Petroleum Geology |
|---|---|
| Part | Critical elements of the petroleum system |
| Chapter | Sedimentary basin analysis |
| Author | John M. Armentrout |
| Link | Web page |
| Store | AAPG Store |
Impact of growth-fault movement
The multiple phases of petroleum charging the East Breaks 160-161 reservoirs and their accumulation within the anticlinal trap is interpreted to be controlled by the timing of growth-fault movement. Fault movement and fault-associated fracturing in the adjacent rocks could enhance the migration conduit. Migration up the fault would have provided petroleum charge into the intersected reservoir sandstones.
Fault movement and trap formation

Rollover into the growth-fault-initiated trap formation occurred between about 1.2 Ma and the present. Fault movement occurred during each lowstand of sea level when differential loading from shelf-edge deltaic sedimentation and consequent salt withdrawal destabilized the upper slope system.[2] Given the sea-level fluctuation cycles documented within the East Breaks 160-161 minibasin[3][2] at least five and potentially nine lowstand events may have caused episodic movement of the north-bounding growth fault of the East Breaks 160-161 field (Figure 1, nine cycles between 1.2 Ma and the present).
Sandbody geometries
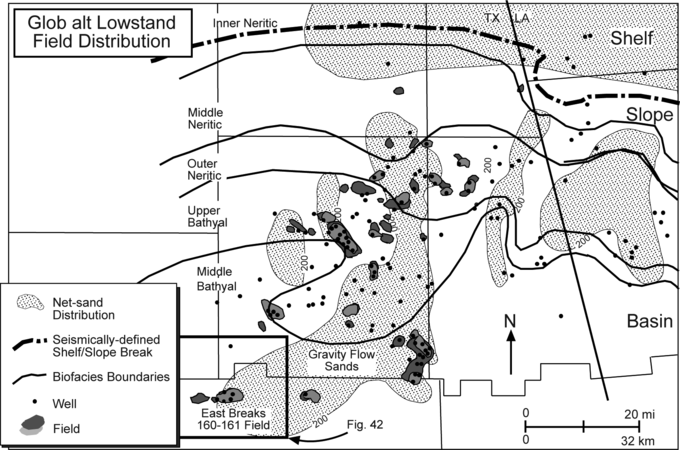
Figure 2 East Breaks 160-161 mini basin.
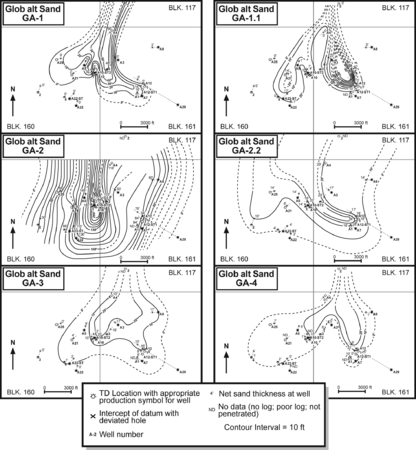
Figure 3 Elongate and lobate north-to-south geometries. From Armentrout et al.;[4] courtesy Springer-Verlag.
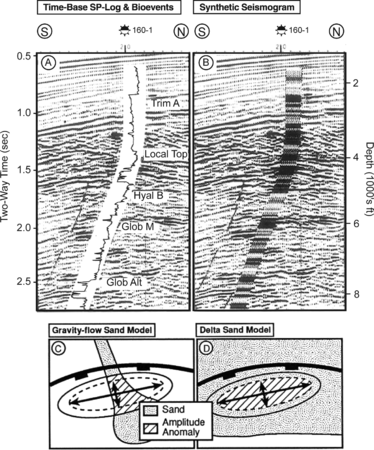
Figure 4 seismic reflection amplitude pattern that shows north-to-south flank structural downdip termination.


The gravity-flow sandstone reservoirs within the field were transported from the north, southward into the East Breaks 160-161 mini basin (Figure 2), where the mapped pattern of the Glob alt sandstones show elongate and lobate north-to-south geometries (Figure 3). These north-to-south depositional geometries are draped over the east–west down-to-the-north rollover anticline, resulting in a seismic reflection amplitude pattern that shows north-to-south flank structural downdip termination (Figure 4C). East-to-west reflection amplitude termination is stratigraphically controlled by sand distribution. This petroleum-associated reflection amplitude pattern is in contrast to that for sheet sands that would drape over the entire structure and show four-way downdip structural termination of seismic reflection (Figure 4D).
Tying seismic to well data
Figure 4 is a seismic reflection profile across the East Breaks 160-161 field, showing the 160 No. 1 well SP log and synthetic seismogram and two schematic diagrams for interpreting possible seismic reflection amplitude anomaly maps, which could indicate hydrocarbon-charged sands. Bioevent horizons correlate with the top seal above each reservoir interval. Only the lower Trim A and Glob alt reservoir sandstones are well developed in this well. The depositional model for a delta-front sheet sand extending over the entire postdepositional anticline is likely to have four-way downdip termination of petroleum-associated seismic reflection amplitude anomalies (Figure 4C). The depositional model for a depositional dip-oriented gravity-flow sandstone draped over the postdepositional anticline is likely to have two-way structural termination of a petroleum-associated seismic reflection amplitude anomaly, with stratigraphic termination of reflectors along both depositional-strike directions (Figure 4D). The mapped amplitude pattern in both the Trim A and Glob alt intervals agrees with a channel-fed gravity-flow depositional system.
Recharging of reservoirs
Preserving these petroleum resources has been discussed in reference to biodegradation, which has produced much of the gas in the reservoirs—especially at the Trim A horizon. Burial of the reservoirs to depths with temperatures in excess of temperature::140°F (temperature::60°C) prevents further microbial degradation of the oil. Late episodes of fault movement facilitates recharging the reservoirs with higher maturity oil, migrating upward from the deeply buried active source rock that is not yet specifically identified (see Anderson[5][6]).
See also
- East Breaks petroleum system
- East Breaks trap formation
- East Breaks geochemistry
- East Breaks hydrocarbon generation model
- East Breaks hydrocarbon migration model
- East Breaks critical moment
References
- ↑ Armentrout, J. M., 1996, High-resolution sequence biostratigraphy: examples from the Gulf of Mexico Plio–Pleistocene, in J. Howell and J. Aiken, eds., High Resolution Sequence Stratigraphy: Innovations and Applications: The Geological Society of London Special Publication 104, p. 65–86.
- ↑ 2.0 2.1 Armentrout, J., M., 1993, Relative seal-level variations and fault-salt response: offshore Texas examples: Proceedings, Gulf Coast Section SEPM 14th Annual Research Conference, p. 1–7.
- ↑ Armentrout, J., M., Clement, J., F., 1990, Biostratigraphic calibration of depositional cycles: a case study in High Island–Galveston–East Breaks areas, offshore Texas: Proceedings, Gulf Coast Section SEPM 11th Annual Research Conference, p. 21–51.
- ↑ Armentrout, J. M., S. J. Malacek, P. Braithwaite, and C. R. Beeman, 1991, Seismic facies of slope basin turbidite reservoirs, East Breaks 160-161 field: Pliocene–Pleistocene, northwestern Gulf of Mexico, in P. Weimer and M. J. Link, eds., Seismic Facies and Sedimentary Processes of Submarine Fans and Turbidite Systems: New York, Springer-Verlag, p. 223–239.
- ↑ Anderson, R., N., 1993, Recovering dynamic Gulf of Mexico reserves and the U., S. energy future: Oil & Gas Journal, 26 April 1993, p. 85–88, 90–92.
- ↑ Anderson, R., N., Flemings, P., Losh, S., Austin, J., Woodhams, R., 1994, Gulf of Mexico growth fault drilled, seen as oil, gas migration pathway: Oil & Gas Journal, 6 June 1994, p. 97–104.
External links
| find literature about East Breaks hydrocarbon accumulation model |