File:Multivariate-data-analysis fig1.png
Jump to navigation
Jump to search

Size of this preview: 605 × 599 pixels. Other resolutions: 242 × 240 pixels | 957 × 948 pixels.
Original file (957 × 948 pixels, file size: 85 KB, MIME type: image/png)
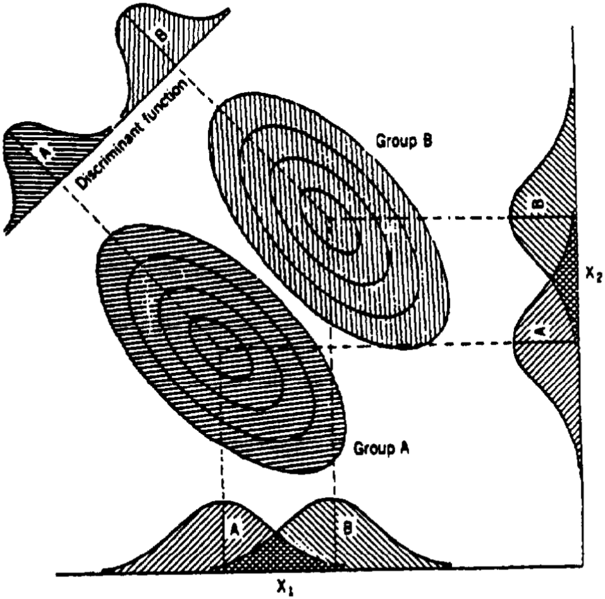
Plot of two-blvariate distributions, showing overlap between groups A and B along both variables <italic>x</italic>1 and <italic>x</italic>2. Groups can be distinguished by protecting members of the two groups onto the discriminant function line. (From Davis, 1986.)
File history
Click on a date/time to view the file as it appeared at that time.
| Date/Time | Thumbnail | Dimensions | User | Comment | |
|---|---|---|---|---|---|
| current | 00:51, 14 January 2014 | | 957 × 948 (85 KB) | Importer (talk | contribs) | Plot of two-blvariate distributions, showing overlap between groups A and B along both variables <italic>x</italic><sub>1</sub> and <italic>x</italic><sub>2</sub>. Groups can be distinguished by protecting members of the two groups onto the discriminan... |
You cannot overwrite this file.
File usage
The following page uses this file: