Gas chromatography: data obtained
| Exploring for Oil and Gas Traps | |

| |
| Series | Treatise in Petroleum Geology |
|---|---|
| Part | Critical elements of the petroleum system |
| Chapter | Oil–oil and oil–source rock correlations |
| Author | Douglas W. Waples, Joseph A. Curiale |
| Link | Web page |
| Store | AAPG Store |

In gas chromatography the distributions of n-alkanes and isoprenoids are usually most useful. Of particular significance for correlations are the wax content (C23+), the carbon preference index (CPI)[1] and the pristane-phytane ratio (Pr/Ph). The following figures show gas chromatograms of the saturate fractions of several oils, illustrating the differences that can be observed in these compound classes as a result of differences in the source material.
Examples
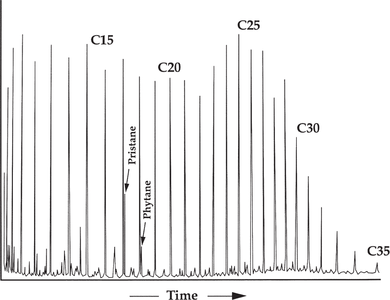
Figure 1 Gas chromatogram of a high-wax oil of terrestrial origin with an odd-carbon preference in the wax region and a high pristane-phytane ratio typical of coaly or certain nearshore aquatic environments. From Robinson;[2] reprinted with permission from the Indonesian Petroleum Association.
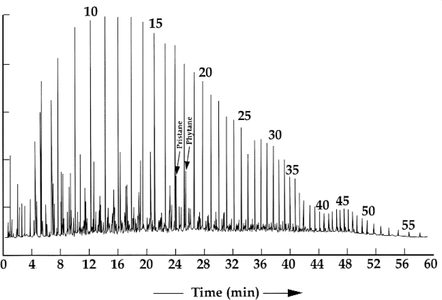
Figure 2 Gas chromatogram of an extremely waxy oil from the Paradox basin, Utah. Copyright: Unocal.
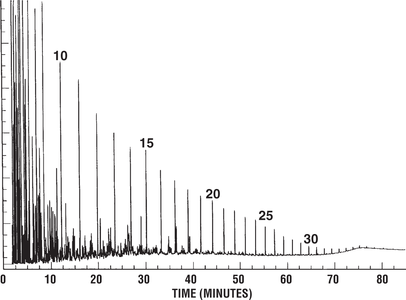
Figure 3 Gas chromatogram of a low-wax oil derived from typical marine algae. Copyright: Unocal.
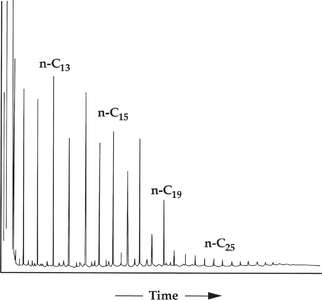
Figure 4 Gas chromatogram of saturates from an Ordovician-sourced oil from the Illinois basin. From Hatch et al.;[3] reprinted with permission from AAPG.


Example: oil of terrestrial origin
Figure 1 is a gas chromatogram of a high-wax oil of terrestrial origin with an odd-carbon preference in the wax region and a high pristane-phytane ratio typical of coaly or certain nearshore aquatic environments. Significant input of terrigenous organic matter is indicated by a bimodal n-alkane distribution (a second mode in the wax region, from n-C23 to n-C31), a pristane:phytane ratio greater than 2.0, and a strong odd-carbon n-alkane dominance from n-C25 to n-C31. These features are characteristic of deltaic- or lacustrine-sourced oils (in this case, from Indonesia).
Example: oil of marine origin
Figure 2 is a gas chromatogram of an extremely waxy oil from the Paradox Basin, Utah. It was sourced from a marine anoxic evaporitic carbonate. Here the waxes, which are not derived from terrestrial plants, show an even-carbon preference, and the pristane-phytane ratio is very low.
Example: oil of marine algal origin
Figure 3 shows a gas chromatogram of a low-wax oil derived from typical marine algae. Pristane-phytane ratios for such oils tend to be slightly above 1.0. This Alaskan oil was derived from a source rock containing predominantly marine algal organic matter.
Example: Oil derived from G. prisca
Figure 4 is a gas chromatogram of saturates from an Ordovician-sourced oil from the Illinois Basin. It shows a low-wax oil derived primarily from the primitive organism Gloeocapsamorpha prisca. Samples derived from G. prisca show strong odd-carbon preferences up to n-C19, and have very low concentrations of both pristane and phytane.[4][5][3][6]
G. prisca
G. prisca is well known from the Ordovician (and is thus a useful age marker), but the gas chromatographic characteristics of G. prisca or its descendants have been seen in rocks as young as Devonian. In some studies of the Michigan Basin, a few of which predated the recognition of the geochemical peculiarities of G. prisca, several workers mistook the presence of G. prisca-like chromatographic characteristics in the Devonian oils as absolute indicators of an Ordovician source. In fact, some of the Devonian source rocks themselves show the same characteristics (D. Waples, unpublished data).
X-compounds

Figure 5 shows an example of an unusual group of alkanes called X-compounds. They contain one or more methyl branches near the middle of a long-chain hydrocarbon. These compounds originate from primitive cyanobacteria (blue-green algae) and are diagnostic of Precambrian sources.
Resin-derived terpanes

Sesquiterpanes and diterpanes, derived principally from the resin in terrestrial plants of the Upper Cretaceous and Cenozoic, are often abundant in younger samples with terrestrial plant input. In such cases, they usually can be seen (although not interpreted in detail) using gas chromatography. The chromatogram in Figure 6 of the saturated hydrocarbons from a rock extract shows minor amounts of sesquiterpanes (the cluster of peaks eluting near n-C15) and large amounts of diterpanes (the small cluster of peaks eluting near n-C20). Samples containing sesquiterpanes and diterpanes often display other characteristics of terrestrially influenced samples, such as odd-carbon preferences, high wax contents, and high pristane–phytane ratios. To analyze the resin-derived terpanes in detail, however, we should use GC/MS.
Bisnorhopane

An unusual biomarker is 28, 30-bisnorhopane, which can be extremely abundant in those few samples where it is present. Figure 7 shows gas chromatograms of two extracts of immature source rock candidates in southern California (Monterey Formation, Santa Maria Basin). They contain bisnorhopane as well as a series of monoaromatic steroid hydrocarbons. These two biomarker types, together with the low pristane-phytane ratios shown here, are characteristic of Monterey oils. These distinctive characteristics provide a fairly confident correlation to Monterey oils, despite the very low maturity of the source rocks.
Other minor components

Other minor components present in gas chromatograms can be used for correlations, even when compound identities are not known. However, one should always treat unidentified compounds with caution, since they may represent contaminants, or their concentrations may be affected by maturity or alteration effects.
Figure 8 shows gas chromatograms of two oils from Texas and Oklahoma. Full-scale chromatograms on the left show the oils are not degraded, a condition necessary for this type of correlation. The shaded areas indicate the regions expanded on the right. Based on the many similarities in the expanded-scale chromatograms and on other geochemical similarities, it was concluded that these two oils were derived from the same lower Paleozoic source facies.
Star diagrams
Star diagrams (polar plots) are sometimes used to display the relative amounts of a series of peaks in a chromatogram. See, for example, Kaufman et al.[10]
Limitations due to maturity differences
Maturity-related differences are often observed when comparing oils with each other and with source rock extracts. High-wax oils are affected most strongly by maturity. Maturity differences involving source rocks can present particular difficulties when source rock samples are extremely immature.
For these reasons, and also because of the possibility of fortuitous similarities between unrelated samples, gas chromatography seldom provides definitive positive correlations. It may, however, provide fairly definitive negative correlations. When used in conjunction with other correlation parameters, it can often be valuable for positive correlations as well, as demonstrated in the following two examples.
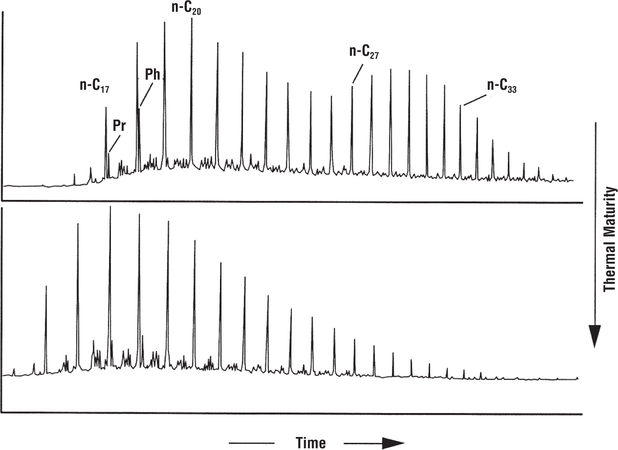
Figure 9 Gas chromatograms of two oils from Wyoming. From Peters and Moldowan;[11] reprinted with permission from Prentice-Hall.
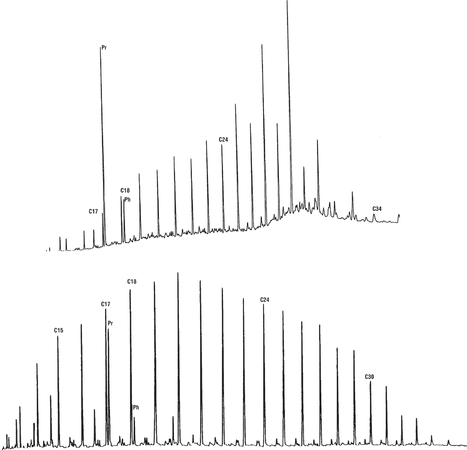
Figure 10 Gas chromatograms of saturated hydrocarbons from an immature extract of coaly organic matter (top) and an oil with a fairly high wax content believed to have been sourced from a similar facies (bottom). Copyright: Unocal.


Maturity difference example
Figure 9 shows gas chromatograms of two oils from Wyoming. Both were sourced from the Permian Phosphoria Formation, but are reservoired in different fields. The bimodal distribution of n-alkanes in the top oil is consistent with a lower level of maturity than that of the unimodal oil at the bottom. Comparison of these oils using gas chromatography for the purpose of oil–oil correlation must be done with caution because of the maturity differences.
Examples of maturity differences
Figure 10 shows gas chromatograms of saturated hydrocarbons from an immature extract of coaly organic matter (top) and an oil with a fairly high wax content believed to have been sourced from a similar facies (bottom). Both show many of the same characteristics—high wax content, odd-carbon preference in the wax range, high pristane-phytane ratio—but maturity effects have changed many of the details.
Limitations due to evaporative loss
Evaporative loss can affect the appearance of gas chromatograms. When the solvent is removed too fast during recovery of source rock extracts, selective loss of some of the C15+ components can occur. This loss not only alters the appearance of the gas chromatograms but may also change compound ratios (for example, the pristane-phytane ratio through selective loss of pristane). In some instances, gas stripping in the reservoir can selectively remove lighter components, leaving an oil or residue that looks lightly biodegraded or, in some instances, waxy.
Example of loss of C15+ fraction
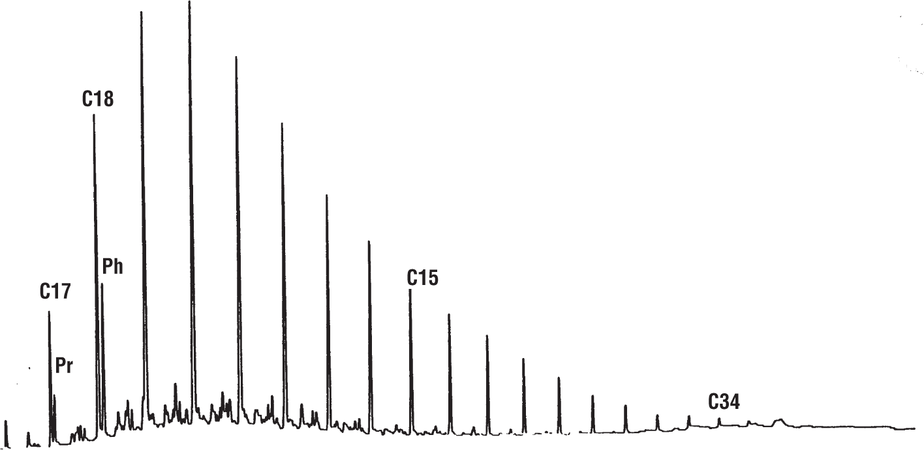
Figure 11 gas chromatogram of saturated hydrocarbons in a source rock extract from which the extracting solvent was evaporated too vigorously, leading to loss of some of the C15+ fraction. Copyright: Unocal.
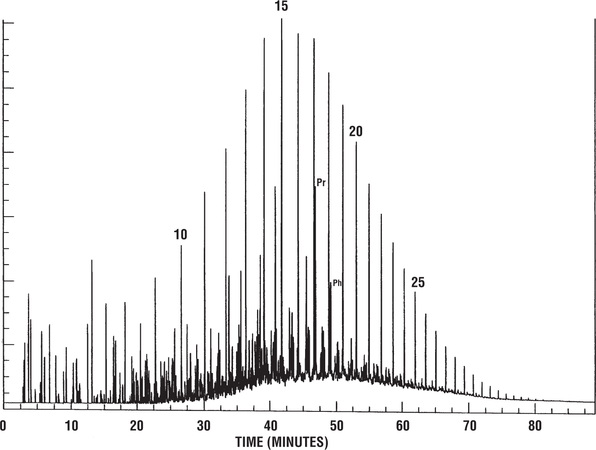
Figure 12 Gas chromatogram of an oil whose light ends were partially removed during gas stripping in the reservoir. Copyright: Unocal.


Figure 11 shows a gas chromatogram of saturated hydrocarbons in a source rock extract from which the extracting solvent was evaporated too vigorously, leading to loss of some of the C15+ fraction. This problem can be recognized by looking at the n-C17 and n-C18 peaks. Normally they are almost the same size, but in this case the n-C17 peak is much smaller. Pristane has also been depleted relative to phytane, leading to an erroneous pristane-phytane ratio unless some correction is made.
Example of loss of light ends
Figure 12 shows a gas chromatogram of an oil whose light ends were partially removed during gas stripping in the reservoir. Oils like this one are often observed in deep reservoirs in Tertiary deltaic sequences.
Limitations due to internal standards
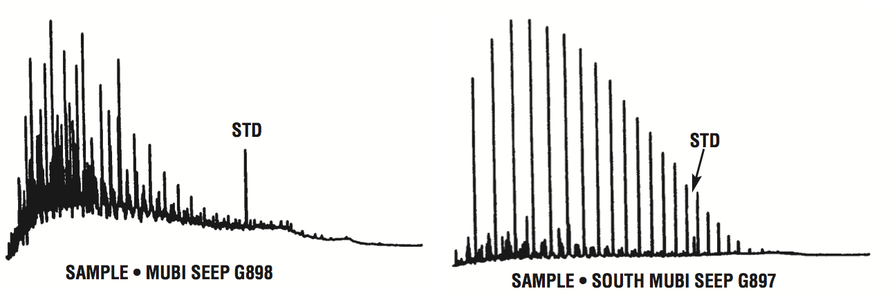
Figure 13 Gas chromatograms of the saturated hydrocarbons from two seep oils from Papua New Guinea.
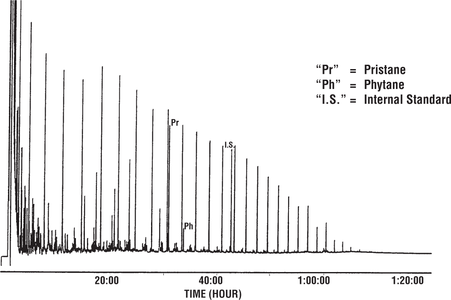
Figure 14 Gas chromatogram of the saturated hydrocarbons from the Lufa seep oil, another seep oil from Papua New Guinea. Copyright: Murray et al.;[12] courtesy Australian Geological Survey Organization.


An internal standard is commonly coinjected with the sample to aid in quantification during gas chromatography. If this internal standard is not clearly labeled on the chromatogram, it may be confused with an indigenous compound and erroneously used in correlation.
Examples of problems with internal standards
Figure 13 shows gas chromatograms of the saturated hydrocarbons from two seep oils from Papua New Guinea. Both samples contain an internal standard that elutes just before n-C21. Because the left oil is biodegraded, the detector sensitivity was set very high to record the trace amounts of remaining n-alkanes. Consequently, the internal standard peak is very tall. In contrast, the right oil (undegraded) shows a much smaller internal standard peak because the detector sensitivity was lower.
Figure 14 shows a gas chromatogram of the saturated hydrocarbons from the Lufa seep oil, another seep oil from Papua New Guinea. Because this work was carried out by a different laboratory than the analyses in the previous figure, the internal standard used here is different. This standard elutes just before n-C22. The pristane–n-C17 ratio suggests that this oil is different from those in Figure 13, a fact confirmed by other geochemical evidence.
Limitations due to contaminated samples

In other cases, particularly in rock extracts, the sample may be contaminated. Plasticizers, for example, are common but are usually easy to recognize. Figure 15 shows a gas chromatogram of saturated hydrocarbons from a source rock sample contaminated with bits of plastic. The largest peak is dioctyl phthalate, derived from contact with the plastic.
Biodegradation limitations

Biodegradation can severely alter gas chromatograms. In the earliest stages of biodegradation, n-alkanes are removed selectively, leading to significant loss of information.
Examples of biodegradation
Figure 16 (left) shows gas chromatograms of three oils from a common source in central Myanmar. A waxy oil (top) is sequentially converted into an extremely biodegraded remnant oil (bottom). The API gravity of the oil decreases and sulfur content increases substantially with increasing biodegradation.
Pristane-phytane ratios may also be affected slightly at low stages of biodegradation. At moderate levels these compounds are removed completely (left figure). The right figure below shows whole-oil gas chromatograms of three oils from the offshore Mackenzie Delta, northwestern Canada, showing a modest decrease in the pristane-phytane ratio, apparently as the result of minor biodegradation.
See also
- Gas chromatography/mass spectrometry (GC/MS): procedures
- Gas chromatography/mass spectrometry (GC/MS): examples of correlations
- Gas chromatography/mass spectrometry (GC/MS): limitations
- High-performance liquid chromatography
References
- ↑ Bray, E. E., E. D. Evans, 1961, Distribution of n-paraffins as a clue to recognition of source beds; Geochimica et Cosmochimica Acta, vol. 22, p. 2–15., 10., 1016/0016-7037(61)90069-2
- ↑ Robinson, K. M., 1987, An overview of source rocks and oils in Indonesia: Proceedings, Indonesian Petroleum Association 16th Annual Convention, p. 97–122.
- ↑ 3.0 3.1 Hatch, J. R., J. B. Risatti, and J. D. King, 1990, Geochemistry of Illinois basin oils and hydrocarbon source rocks, in M. W. Leighton, D. R. Kolata, D. F. Oltz, and J. J. Eidel, eds., Interior cratonic basins: AAPG Memoir 51, p. 403–423.
- ↑ Reed, J. D., H. A. Illich, B. Horsfield, 1986, Biochemical evolutionary significance of Ordovician oils and their sources: Organic Geochemistry, vol. 10, p. 347–358., 10., 1016/0146-6380(86)90035-5
- ↑ Longman, M. W., S. E. Palmer, 1987, Organic geochemistry of mid-continent middle and late Ordovician oils: AAPG Bulletin, vol. 71, p. 938–950.
- ↑ Guthrie, J. M., and L. M. Pratt, 1995, Geochemical character and origin of oils in Ordovician reservoir rock, Illinois and Indiana: AAPG Bulletin, vol. 79, p. 1631–1649.
- ↑ Klomp, U., 1986, The chemical structure of a pronounced series of iso-alkanes in south Oman crudes: Organic Geochemistry, vol. 10, p. 807–814., 10., 1016/S0146-6380(86)80017-1
- ↑ Curiale, J. A., D. Cameron, and D. V. Davis, 1985, Biological marker distribution and significance in oils and rocks of the Monterey Formation, California: Geochimica et Cosmochimica Acta, vol. 49, p. 271–288., 10., 1016/0016-7037(85)90210-8
- ↑ Curiale, J., A., 1992, Petroleum geochemistry of Texas and Oklahoma oils from the Marathon/Ouachita foldbelt: Chemical Geology, vol. 98, p. 151–173., 10., 1016/0009-2541(92)90096-N
- ↑ Kaufman, R. L., A. S. Ahmad, and W. B. Hempkins, 1987, A new technique for the analysis of commingled oils and its application to production allocation calculations, in Proceedings of the 16th Annual Convention of the Indonesian Petroleum Association: p. 247–268.
- ↑ Peters, K., E., and J. M. Moldowan, 1993, The Biomarker Guide—Interpreting Molecular fossils in Petroleum and Ancient Sediments: Englewood Cliffs, New Jersey, Prentice-Hall, 363 p.
- ↑ Murray, A. P., R. E. Summons, J. Bradshaw, and B. Pawih, 1993, Cenozoic Ooil in Paua New Guinea--evidence from geochemical analysis of two newly discovered seeps, in G. J. Carman and Z. Carman, eds., Petroleum Exploration and Development in Papua New Guinea: Proceedings of the Second PNG Petroleum Convention, Australian Geological Survey, p. 489-498
- ↑ Curiale, J. A., 1994, Correlation of oils and source rocks—a conceptual and historical perspective, in L. B. Magoon, and W. G. Dow, eds., The Petroleum system—From Source to Trap: AAPG Memoir 60, p. 251–260.
- ↑ Curiale, J. A., 1991, The petroleum geochemistry of Canadian Beaufort Tertiary “non-marine” oils: Chemical Geology, vol. 93, p. 21–45., 10., 1016/0009-2541(91)90062-V
External links
| find literature about Gas chromatography: data obtained |