Relationship between porosity and permeability on fractured basement reservoir
| Wiki Write-Off Entry | |
|---|---|

| |
| Student Chapter | Universitas Gadjah Mada |
| Competition | June 2015 |
Fracture is a non constant rock movement that usually seen as a separation in rock feature locally made and has natural sequence. Most of geological formations on top of earth crust crack at some parts of it. The fracture represents mechanical failure of rock stability because of geological pressure such as plate tectonics, lithostatic pressure exchange, thermal pressure, high pressure fluids, drilling activity, and even fluids movement, because fluids has a role as burden in the overburden rock. Even though, petroleum reservoar rocks can be found in most of depth, in deeper depth, the overburden pressure is enough to deform sedimentary rock plastically. It cannot hold on from shear pressure for a long period and flows until balanced state.
Fracture can appear as a long micro rock separation in micrometer or continental fault until thousands of kilometers. It can be limited by a rock formation or a layer of rock, a fracture is a nonconstanly straight or curve line because brittle deformation process in earth crust. The plane is a weak part of rock’s feature from pressure exchange on earth crust because of fracture from one or more different ways, depends on pressure direction and type of rock. A fracture contain 2 uncommon rock’s surface, and contact each other. Volume between surfaces is called by fracture gap.
Naturally, rock is fractured can be categorized into 3 type geologically, based on porosity system :
- Intercrystalline-intergranular
- Fracture matrix
- Vugular
Accumulation and migration of reservoir fluids on rock formation that crack naturally has first porosity type from porosity systems which look like as ussual sandstone formation. As a result of it, the technique that has been developed for define physical feature of porous sandstone, can be also used for a intercrystalline- intergranular porosity formation. However, the reservoir problem does not include both of the another porosity system types. Porous of matrix from a formation that has fracture matrix, usually disconnected each other, so that fluids exchange system extremelly different from common sandstone formation. Vugular rock produce a porous that shows various permeability distributions from relatively uniform until shapeless form.

Rock fracture petrophysics
Altough well-logging technique such as NMR (Nuclear Magnetic Resonance) is used as rock permeability calculation, it has not developed well. The only one closest method with permeability value is by combining parameters that gained from rock core and log data processing in computer to produce relation between permeability, fracture matrix system, porosity, and unreducted water saturation value. There is an effort to combine the relation of grain diameter with shale fraction in some models for explain the data. With relation between petrophysics parameter from the formation, include permeability distribution, can be achieved from log data of a well without core. But, in carbonaceous rock formation, where unconformity structure and textures changes can be frequently found, and small amount of core data, so the use of statistic corelation is limited. The corelation cannot be used for hydraulic channel identification or fracture on reservoir body.
Definition of double porosity

On fractured reservoir, total porosity is the sum of primary porosity and secondary porosity

the value of porosity is equal with static definition of rock capacity or total void volume of rock.
From experiment, expert has found that with various rock types, fractured porosity has a smaller value than matrix porosity. Both porosities are defined with common definition, and relatively to total volume of fracture and matrix.
φ1 = void volume of matrix or total bulk volume φ2 = void volume of fracture or total bulk volume
Correlation between matrix porosity (φm) and fracture porosity (φf), is matrix porosity that refers to total matrix in rock, can be formulated as :

while fracture porosity is

in this case, primary porosity is functionalized as matrix porosity, with this formula,

and effective primary porosity that contain oil, define with formula,

porosity is illustrated schematically in image above, whereas unit of total rock is scaled on top and total of matrix in rock is scaled in bottom. With matrix porosity (φm), water saturated part, oil saturated part, and each parts are expressed as percentage of all matrix units in rock.
Double porosity also has an important part in evaluation dynamic, where the rock’s capacity also called as storage capacity. The parameter is expressed with combination of parameter φC, which shown total expantion and or capacity when it compressed from fluids and void volume of rock.
Fractured reservoir permeability
The existence of two systems (matrix and fracture), permeability can be defined as matrix permeability, fracture permeability and system permeability between fracture and matrix.
Primary definition of permeability is fracture permeability can be interpretated as single fracture permeability or fracture system permeability or sometime fracture permeability of total fracture volume of rock. So permeability will be defined more detail.
Problem of unconformity of rock type for limited time in reservoir has variation of direction of permeability and effects in field. Then, reservoir unconformity relation to relative permeability is found. Between unconformity variation of reservoir, the most significant is formation’s layer where normal or parallel channel to layer or double system porosity such as combination between matrix fracture, matrix-hole, or fractured matrix-hole.
Sandstone formation layer is one of type of unconformity that commonly appear. The layer can be seen as rock compotition of other layer from matrix- supported and grain-supported that forms numbers of layers with different thickness and permeability. Direction of the channel can be paralel to layer or cut the layer formation. Relation between layer characteristic and flow direction can effects the evaluation of relative permeability.
The closure of this solution from relative permeability calculation for oil and gas system in case of great number of layers formation has been given by Corey.
Theoretical closure
Evaluation of relative permeability has generate formula.
Capillary pressure, desaturation curve is expected with formula,

Where B is constant and S*oe is effective saturation in oil (percentage of volume in effective porous for run off the fluids). Relative permeability is expressed to function of saturation,

![{\displaystyle K_{rg}=(1-{\text{S*}}_{o})^{2}[1-({\text{S*}}_{o})^{2}]}](https://wikimedia.org/api/rest_v1/media/math/render/svg/3b62107cc46c8c3322b29ec43c1e2328bf926523)

In carbonaceous rock whereas secondary porosity vuggy tipe is developed as a extra of intergranular porosity, conventional calculation is asked if the secondary porosity is significant and distributed.
Relative permeability in porous rock that contain oil-water (laboratory experiment)
Common feature of relative permeability in water-oil has been tested in laboratory in porous layer so it gets qualitative characteristic. In high velocity, water washes oil completely from matrix, but in low velocity where capillary pressure become significant, oil stuck in the porous. So from that, it produce 2 type of curves, which is:
- A Type, whereas both curves relative permeability show linear variation with water saturation. Sometime water still flow in the bottom part that contains oil.
- B Type, contain a solution that in porous, oil fully washed away. Relative permeability from water in rock various from zero when oil in porous, until one when oil is removed.
Simulation of relative permeability and laboratory test is conducted by Archer, 1973, in porous carbonaceous rock. It shows that there is a different thing between core data in laboratory and simulator where the piston exchange is done like conventional reservoir.
From experiment that done by Abgrall dan Iffly, 1973, shows that gas saturation can be very high when velocity decrease very slowly. Gas phase in porous without move from porous until most of oil transmigrate from it. This explain the fact that gas in porous cannot remove oil in matrix around the porous because of capillary pressure hold it. Until gas saturation developes in matrix become matrix porous system that explained in Kg/Ko vs Sg calculation. Behaviour of relative permeability is explained in the curve below. This curve illustrate the differentiation between intergranular matrix with and without porous (bugs).
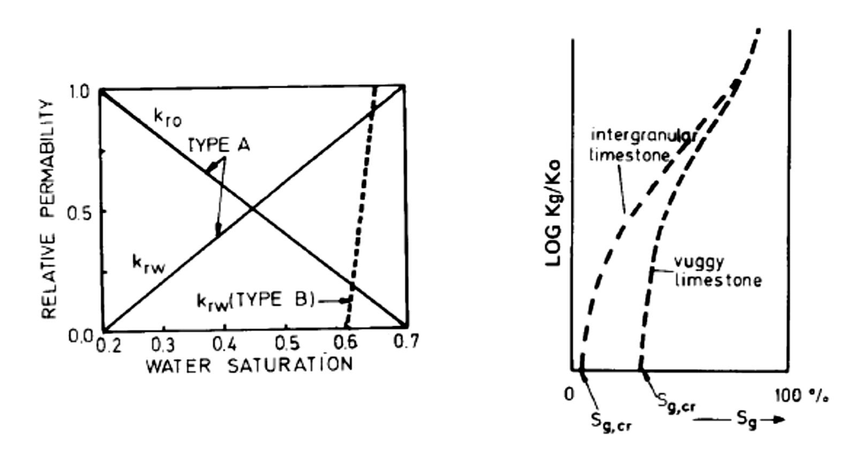
Figure 3 Relative permeability in porous and relative permeability curve (Golf-Racht, 1982)
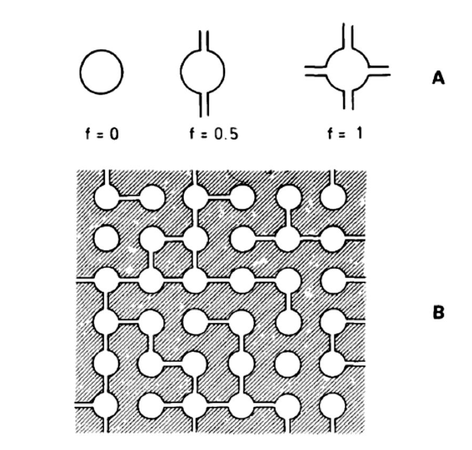
Figure 4 Fracture model on porous. Type A structure and probability factor f. B. Matrix and fracture on porous f = 0,5 (Erlich, 1971)


Velocity, in pressure with low reduction ΔP/Δt very important for replace relative permeability curve in porous limestone with Kg/Ko value specifically.
Relative permeability from fracture and porous generate secondary porosity of limestone that has been tested with simplified model which has been developed by Erlich, 1971. It contains isolated porous in matrix, and connected porous with one or two direction cracks. Porous and fracture that connected is expressed with probability f, that indicates degree between porous connection with fracture. Value variation f from 0 – 1 is ilustrated in image below. The example of relation between fracture and porous, shows comparative size in matrix with probability fracture factor f = 0,5. Residual saturation of oil has been evaluated by Erlich model with dimension of 12 x 12 with random process based on probability realtion between porous and fracture. In this case, there are 312 fracture location possibilities. If some of the fracture filled with oil and water, transmigration process can be simulated. For water and oil transmigration, residual saturation of oil is used as parameter function f. Product of this simulation has been compard with core data and adjusment, shows no execption in core with huge secondary porosity, where transmigration cannot be mixed and value of residual saturation is producted separately. This model on fracture-matrix part known as pseudo-function so it is possible to make a better closure to transmigration evaluation.
Relative permeability in fracture-matrix system or fracture-crack-matrix system can be tested with core in laboratory with conventional method. This procedure more successfu as primary direction determinant from visible fracture. This closure can be done with using unconformity rock method so can make pseudo- relative permeability curve.
Relative permeability concept is developed by Braester. The basic principal is :
- On fractured reservoir, with pressure gradient ignored, exact change from fracture-matrix by fluids.
- Wetting phase or non-wetting from fracture is circulated from matrix fracture and return to fracture, saturation zone with oil and water phase.
- In relative permeability model become function of fracture and porous media.
- Process is assigned as throughout flow to second zone, matrix and fracture.
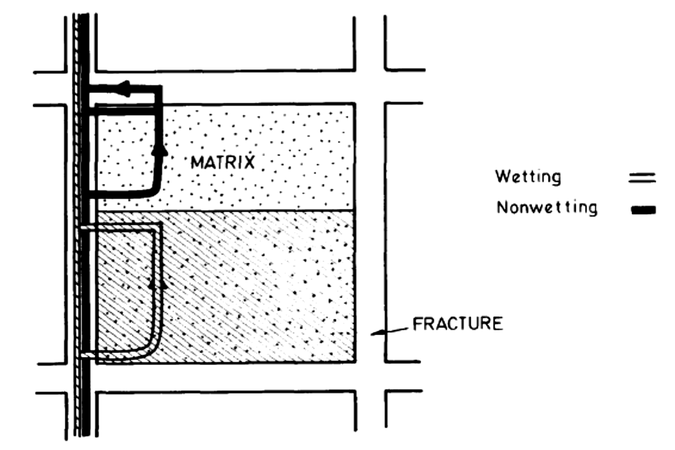
Figure 5 Flow schematic process between matrix and fracture of wet and dry phase (Braester, 1972)
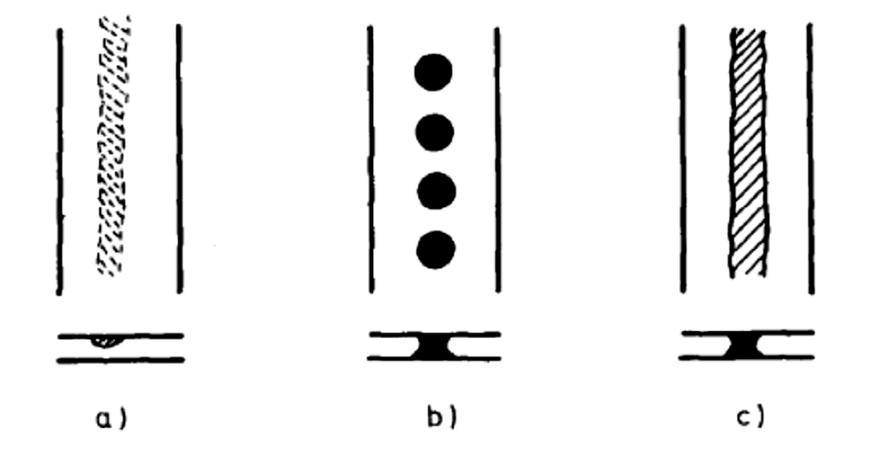
Figure 6 Flow regime in fracture a. trickle flow b. bubble flow c. string flow (Torsaeter, 1980)
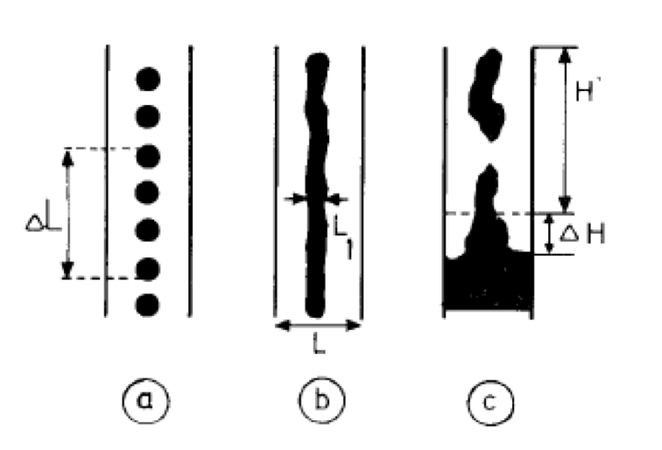
Figure 7 Calculation of saturation of fracture when segregation. A. droplets b. strap c. segregation of water (Torsaeter, 1980)


Schematic representation of relative permeability curve can be seen in the image above, whereas first asumtion from continuity of each part flow and fracture so it produce :
- Shape of 2 relative permeability curve Kro, Krw can be various depends on water fracture saturation function (Sw2).
- Connection between two fracture:
^{2}(1-S_{w2}^{2})}](https://wikimedia.org/api/rest_v1/media/math/render/svg/bc2ff0949c8b60337374170a9df92673f5ba8000)
![{\displaystyle K_{rw}=\left[{\frac {K_{2}}{K}}+\left(1-{\frac {K_{2}}{K}}\right)S_{w2}^{4}\right]S_{w2}^{4}}](https://wikimedia.org/api/rest_v1/media/math/render/svg/cf377e56751015020e4e886de479547d19a62419)
Which is similar to Corey’s calculation.
Evaluation of relative permeability in fracture system must be treated with different way with flow in porous media, because of hydraulic radius of fracture can be more greater than porous radius in intergranular conventional rock. Commonly, channel has 2 phases in fractured media that has assosiation with flow condition and physical parameter of fluids and rocks.
Flow condition is illustrated in image below, where trickle flow (first image) may the bazaar phase from bubble to follow one wall; bubble flow (second image) where bubble flow both fractured walls so there is bouyancy force; string flow (third image) fluids that appear constantly and wet phase follows fractured wall.
Physical parameter of fluids and rock that effects flow in the fractured media are density, viscosity, surface tension, bazaar properties, fracture length, fractured wall roughness, and tilt degree. First thing that must be known is 2 phases flow in relative permeability which can be seen in simplified model Romm, 1966., that produce 10 until 20 paralel fracture. Saturation is counted with electric resistance value and evaluated permeability of velocity flow of fluids, water, and kerogen. The result will show linear tred of diagram Kf vs saturation. It also determine the limit value of 2 phase from unreducted fracture flow become a result of a fracture. Relation between fractures can be modified each flow characteristics perfectly.
Other experiments conducted by du Prey, 1973, which resulted in two models where fluid is injected from one and more holes. Relative permeability derived from the value of Qo and Qw through the equation:


Because of the pressure ΔPo and ΔPw can’t be measured if the fluid is moving, so that the problem should be avoided by maintaining a phase that doesn’t move and forget about the possibility of them, moving as the effects of segregation fluid. In this case, instead of a decrease in pressure, gravity

plays a role. Saturation is given in varying conditions of flow by counting the length of time or the time of trial.
Fractures intensity index

Tension Guess makes rock moving along the main fault fracture which increases porosity (φf), and fractures of the reduction in width (wf) and length (hf) and the frequency of presence (FII) away from the fault plane as illustrated in Figure 8.
Permeability is more influenced by the dimension of fracture than the matrix porosity or total porosity. The curve which shows equations to block up and down as follows :
- Block up
- Block down


Where:
- dLU = lateral distance to the fault plane for block up, feet
- dLD = lateral distance to the fault plane for block down, feet
- FII = fracture intensity index, fraction
In-situ value of fracture intensity index estimated from:

The equation for blocks up can be used for distances of 250 to 5000 feet and FII value range is 7 to 25%, and equations for blocks down can be used for distances of 250 to 1250 feet and FII value range is 7 to 25%. That correlations were developed from the well data which obtained in Pirson near to Luling-Mexia fault in Austin. The main function of both these correlations is at the time of exploration and discovered the presence of fault of seismic data where the data obtained is only the distance from the fault. It is important to know the influence of FFI of several factors, including the number and geometry of fractures and not all of fractures are the result of fault.
The following equation can be used to estimate the fracture area and fracture permeability in the reservoir which spreader:
![{\displaystyle w_{f}={\frac {0.064}{\phi _{t}}}[(1-S_{iw}){\text{FII}}]^{1.315}}](https://wikimedia.org/api/rest_v1/media/math/render/svg/fa54bfdeafdf69135e8a01ccf0029d8f7a7999a4)
![{\displaystyle k_{f}=1.5\times 10^{7}\phi _{t}[(1-S_{wi}){\text{FII}}]^{2.63}}](https://wikimedia.org/api/rest_v1/media/math/render/svg/92306eb0c1badd75da0dbe5d76c25eba6f61865e)
Where porosity, FII and water saturation were not reduced be expressed as fractions and fracture width and permeability in cm and mD, respectively. Fracture porosity can be directly estimated using the formula:
![{\displaystyle \phi _{f}=\left[R_{mf}\left({\frac {1}{R_{LLS}}}-{\frac {1}{R_{LLD}}}\right)\right]^{2}}](https://wikimedia.org/api/rest_v1/media/math/render/svg/e5a286479237b95c0e05ac17426c4a92a2fe6850)
Where the range of coefficient CT between 2/3 and 3/4. Rmf, RLLS and RLLD is mudfiltrate, laterolog shallow and laterolog deep resistivity in ohm-m, RLLS dan RLLD equivalent to Rxodan Rt,
Example A
Seismic surveys and geological studies have indicated that a well is located in the fracture zone naturally and uppers. Using the data provided, calculate FII and estimate the distance to the closest fault if the resistivity of the zones are not invaded is 7.5 ohm-m.
Solution A
By using the existing formula, fracture intensity index is:

The distance to the closest fault estimated from the correlation of the blocks up and can be estimated using the equation:


The distance to the fault can be estimated using the formula above, so that the value of FII is 15%, and its distance estimated 1100 feet.
Example B
Resistivity surveys in wells generate the following data: the resistivity of the wellbore mud filtrate = 0.165 ohm-m resistivity of water = 0.18 ohm-m, the resistivity of the zones are not invaded = 12 ohm-m, and the resistivity of the formation of the inner = 85 ohm- m. The average porosity of the reservoir (17%) obtained from neutron log. Mud loss is thought to occur when drilling these wells. Analysis of the pressure in the well and in the cores have confirmed the presence of natural fractures in the well.
- Estimate the index of intensity and coefficient of porosity
- If the average water saturation that isn’t reduced from log analysis is 24%, calculate the width of the fracture. Note that the coefficient Cx is 0.25
- Calculate the width of the fracture, fracture permeability, and fracture porosity from formation.
Solution B
- Known RLLS = Rxo = 12 and RLLD= Rt = 85,
- fracture intensity index using the formula:
- Saturation of mud filtrate in the washing zone are:
- Porosity coefficient using the formula:
- fracture intensity index using the formula:
- Using the Formula:
- Using the Formula:
-
- If CT = 3/4, then fracture porosity is:
- If CT = 2.3, fracture porosity is 0.052, so the value of φf is between 0.036 and 0.052.
- Matrix Porosity is:
- If CT = 3/4, then fracture porosity is:
-


![{\displaystyle w_{f}={\frac {0.064}{\phi _{t}}}[(1-S_{wi}){\text{FII}}]^{1.315}={\frac {0.064}{0.17}}[(1-0.24)(0.1417)]^{1.315}=0.02{\text{ cm}}}](https://wikimedia.org/api/rest_v1/media/math/render/svg/10edff131503a3fee725a86d4de31cb480414540)
![{\displaystyle k_{f}=1.5\times 10^{7}\phi _{t}[(1-S_{wi}){\text{FII}}]^{2.63}=1.5\times 10^{7}(0.17)[(1-0.24)0.1417]^{2.63}=7.265{\text{ mD}}}](https://wikimedia.org/api/rest_v1/media/math/render/svg/dcca19bcce8b2239ee56d81e711b7d9b91006966)
![{\displaystyle \phi _{f}=\left[R_{mf}\left({\frac {1}{R_{\text{LLS}}}}-{\frac {1}{R_{\text{LLD}}}}\right)\right]^{C_{T}}=\left[0.165\left({\frac {1}{12}}-{\frac {1}{85}}\right)\right]^{\frac {3}{4}}=0.0358}](https://wikimedia.org/api/rest_v1/media/math/render/svg/54cac6d98f93e531ab90142146d763a6679e5c1c)

Note that total of φf (for CT=3/4) and φm is 0.177 so the estimated is equal to total porosity obtained from well logs. So the fracture porosity of this reservoir is 3.6%.
Relationship Between Porosity and Permeability in Dual Porosity System

Petroleum reservoir can be divided into three main classes based on porosity systems:
- Intergranular
- Intercrystalline-intergranular
- Dissolution that resulted in holes and or fracture naturally
Reservoir with the dilution that results in holes or caves and or different fracture from intercrystalline-intergranular porosity because of double porosity affects the movement of the fluid. Dual porosity can result in fractures and or dissolving that produces holes in the reservoir. Dissolution of the carbonate reservoir form a hole with its porosity systems like Ellenburger Pegasus field and Canyon Reef field, Texas, produces a wide range. Distribution of permeability can form the same appearance or uncommon. Reservoir which has a dual porosity with a uniform permeability distribution can be analyzed as will be described below.
Obtained samples of rock with two porosity with different radii, as shown in Figure 9.
The total flow through the system are among the total of value stream passing of each system, the system has a different petrophysical properties such as porosity and permeability.

Using Darcy's law (for qt) and Poiseuille (for q1 and q2), obtained :
![{\displaystyle kA_{t}{\frac {\Delta P}{\mu L}}=\left[{\frac {n_{1}\pi r_{c1}^{4}}{8}}+{\frac {n_{2}\pi r_{c2}^{4}}{8}}\right]{\frac {\Delta P}{\mu L}}}](https://wikimedia.org/api/rest_v1/media/math/render/svg/06277837f6b31b33e4f4d3a7ff537345ebf02155)
The total area for the system are:

And known also:

By using the substitution equation, obtained:
![{\displaystyle k={\frac {1}{2}}{\frac {\left[{\frac {1}{S_{vp1}^{4}}}+{\frac {1}{S_{vp2}^{4}}}\right]}{\left[{\frac {1}{\phi _{1}S_{vp1}^{2}}}+{\frac {1}{\phi _{2}S_{2p2}^{4}}}\right]}}}](https://wikimedia.org/api/rest_v1/media/math/render/svg/8afb35660785f548a59e68923b6a5c080f9154fe)
The general equation of the formula is :

For single porosity systems, obtained equation has been reduced :

Constanta above associated with the formation of capillaries can be replaced with KT:

Where

In the case of formations that contain little number of holes per unit pore volume, as in a reservoir with high storage capacity in the rock matrix, and the storage capacity is very low in the hole, n1>>n2, the equation can be stated as follows:

Where subscript 1 for the primary pore space that accommodates almost all fluids. In the case of n2 >> n1, for example, on rocks with fluid accommodated in secondary porosity such as cracks and holes. The above equation would be:

Where subscript 2 for secondary pore space. So in the case of n1>>n2 and n2>>n1, dual porosity system can be estimated from a single pore system. n1 approximately equal to n2, because it can not determine the value of n1 and n2, so it can be approached to take the geometric mean of the two capillary system, for example:

Using the average value of rc1 and rc2, and the average value of φ1 and φ2, the equation similar to the Kozeny equation.
Relationship Between Porosity and Permeability in Fractured Basement Reservoir
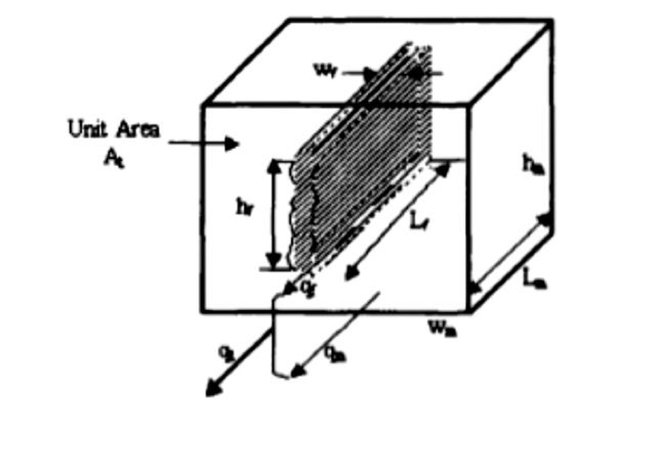
Figure 10 Units model used to calculate fracture permeability in reservoir fracture. (Donaldson, 2004)
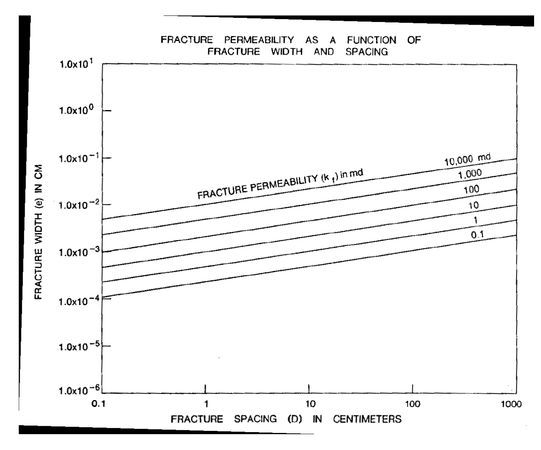
Figure 11 Fracture permeability as a function of the width and spacing of fractures. (Nelson, 2001)
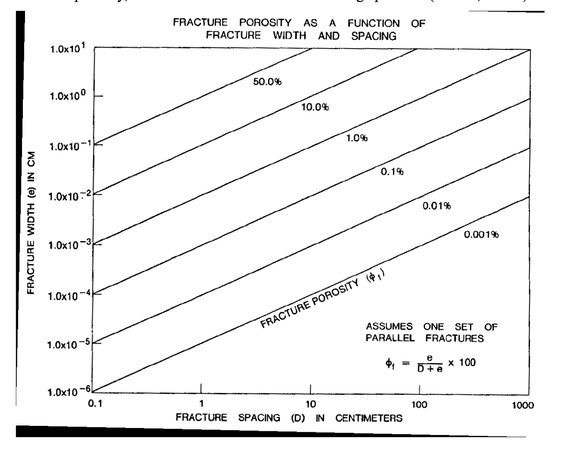
Figure 12 fracture porosity as a function of the width and spacing of fractures. (Nelson, 2001)
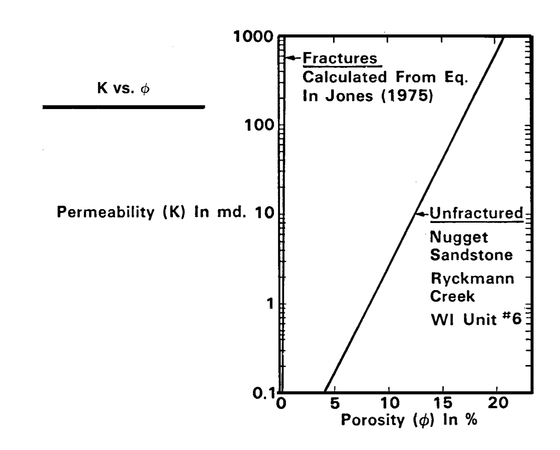
Figure 13 Porosity versus permeability shown relative position of matrix curve and fracture. (Nelson, 2001)


Fracture provides a capacity to store and permeability and fluid flow is controlled by the properties of the fracture. The equation for velocity of volumetric flow, combined with Darcy's law, creating basic approaches to estimate the fracture permeability.
Determined a block of rock that cracking naturally with fractures, as shown in Figure 10.
Assumed fracture is a box, smooth and doesn’t contain any mineral, Hagen- Poiseiulle equation is:

Darcy's law is:

The equation obtained two calculations and troublesolving of permeability results:

Difficulties were obtained using the above equation is the number of fractures, fracture height, and width of fracture should be sought. Thus defined as:

And

So it can be substituted:

Previous equation

where the capillary radius r and constant 8 exchanged with fracture width wf and 12. The equation is usually used to calculate fracture permeability. Fracture porosity in percent and fracture width in micrometers (m), so the equation becomes:

Where kf in darcy.
Previous equation can be used to calculate wf if porosity and permeability are known from well log or well testing :

So that, when viewed the relationship between the dimensions of fractures and fracture permeability, will be shown in Figure 11 (Nelson, 2001). So that, when viewed the relationship between the dimensions of fractures and fracture porosity, will be shown in Figure 12 (Nelson, 2001).
It can be concluded that the relationship between fracture porosity and fracture permeability is directly proportional, the greater the fracture porosity value, the greater the value of the permeability of fractures, as shown in Figure 12.
References
- Ameen, M. S., Fracture and In-Situ Stress Characterization of Hydrocarbon Reservoirs (Geological Society Special Publication)
- Harris, P.M. & Weber, L. J. Giant Hydrocarbon Reservoirs of The World (AAPG Memoir Number 88)
- Harvey, P. K., et al. 2005. Petrophysical propoerties of Cristalline Rocks. London : The Geological Society
- Luthi. S. M. 2005. Fractured Reservoir Analysis Using Modern Geophysical Well Techniques : Application to Basement Reservoirs in Vietnam. Geological Society Special Publication Number 240
- Nelson, R. A., 2001. Geological Analysis of Naturally Fractured Reservoirs Second Edition. Boston : Gulf Professional Publishing
- Petford, N., McCaffey, K. J. W., 2003. Hydrocarbon in Cristalline Rocks. Geological Society, London, Special Publications
- Pirson, S. J., 1970. Geologic Well Log Analysis, Gulf Publishing Co., Houston, TX. Sausse, J. & Genter, A. Types of Permeable Fractures in Granite. Geological Society Special Publication Number 240
- Selley. R. C. 1998. Elements of Petroleum Geology Second Edition. California : California : Academic Press
- Suardana, D., Widjaja, S. 2013. Potential of Development Hydrocarbon in Basement Reservoirs in Indonesia. Jakarta : PPPTMGB LEMIGAS