West Texas Super Basin
| Giant Fields of the Decade: 2010-2020 | |
| |
| Series | Memoir |
|---|---|
| Chapter | West Texas (Permian) Super Basin Unconventional Resources: Exploration, Discovery, and Development |
| Author | Bill Fairhurst |
| Link | Web page |
Exploration, discovery, and economic development of hydrocarbons in unconventional resource reservoirs in the West Texas Super Basin occurred gradually for decades. Knowledge about the basin and potential of unconventional resources and reservoirs are based on research, data, and information obtained during a century of fieldwork on the basin margins. In the basin, economic activity including drilling, subsurface data collection, completions, and production first targeting water, then minerals, and finally hydrocarbons stored in conventional reservoirs more directly contributed to the knowledge of the hydrocarbon potential for unconventional resource reservoirs.
Unconventional resource reservoirs were discovered and developed in the Spraberry 70 years ago, 50 years before unconventional oil and gas resource reservoirs were defined. The Wolfcamp Shale (Wolfberry, combined Spraberry and Wolfcamp in the Midland Basin) discovery occurred over a decade (late 1990s to late 2000s) by a network of individuals across time, several different companies, and outside events.
Similar to the Spraberry decades earlier, the Avalon (Bone Spring) play in the northern Delaware Basin developed from a traditional siltstone play near the basin center to an unconventional resource reservoir as reservoir grain size decreased toward the basin margins. Still, hydrocarbon saturation remained high on the conventional reservoir margins. In the southern Delaware Basin, the necessity for economic success in failing conventional plays lead an independent to change exploration strategy based on observations from a team evaluating subsurface data and information and knowledge of discoveries and development of unconventional resource plays throughout the United States, including the neighboring Midland Basin unconventional resource reservoir plays. These combined northern and southern Delaware Basin unconventional resource plays (Bone Spring and Wolfcamp) also became known as the Wolfbone. The Delaware Basin movement into unconventional resources also gradually occurred over a decade, 2000–2010, a few years behind the Midland Basin unconventional discoveries and early development. However, the majority of the industry did not have significant involvement, investment, drilling, and subsequent production did not show significant results in either the Midland or Delaware Basins until the middle and second half of the 2010–2019 decade and after early development and production acceleration in other oil-rich, unconventional resources, first in the Bakken, then in the Eagle Ford.
The oil price drop from 2014 to 2016 resulted in a decrease of investment and the number of drilling rigs throughout the United States but less in the West Texas Basin. The percentage of total investment and unconventional oil rigs in the West Texas Basin rose to more than 50% of total domestic industry investment and drilling activity, accounted for 35% of domestic oil production, and was the controlling supply-side factor of world oil price. During the first century (1920–2020) of exploration and production, the West Texas Super Basin has produced 63 BBOE. The United States Geological Society (USGS) and Bureau of Economic Geology estimates are that the discovery of the unconventional resource reservoirs (2000–2019) and future development in the West Texas Super Basin could technically produce twice those reserves during the next half-century.
Introduction[edit]
Exploration, discovery, and economic development of hydrocarbons in unconventional resource reservoirs in the West Texas (Permian) Super Basin occurred gradually over decades. Knowledge about the basin and potential of unconventional resources and reservoirs are based on research, published data, and information obtained during a century of fieldwork on the basin margins. In the basin, economic activity including drilling, subsurface data collection, completions, and production first targeting water, then minerals, and finally hydrocarbons stored in conventional reservoirs more directly contributed to the knowledge of the hydrocarbon potential for unconventional resource reservoirs. Significant exploration and discovery events occurred late in 2000–2009, becoming more widely known and developed during 2010–2019. By mid-decade, 2010–2019, investment, development, and hydrocarbon production within the West Texas Super Basin unconventional reservoirs dominated domestic oil and gas industry investment activity, drilling, production, and became the controlling supply-side factor of world oil price.
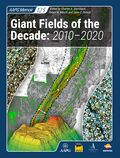
The West Texas Super Basin covers more than 57,500 square miles, as outlined in Figure 1, including more than 50 counties in Texas and 5 counties in southern New Mexico. The basin structure covered a much larger geographic extent during various geologic ages, and sedimentation occurred over a much larger area. Structural and stratigraphic boundaries are difficult to define within a single age, let alone throughout basin development. For example, the eastern border of the basin, as illustrated (Figure 1), is the eastern shelf edge approximate position during the lower Wolfcamp[1][2][3]. The eastern shelf of the basin continues to the Bend Arch, the axis of that feature being 150 miles farther east. The Eastern Shelf of the basin is typically treated as a separate geologic providence, and it is not a focus area for unconventional resource reservoirs currently being developed by the oil and gas industry. The features illustrated in Figure 1 and stratigraphic column, Figure 2 (A, B), provides the framework for the unconventional resource reservoirs, production, reserves, and activity for this work focused on the Spraberry and Wolfcamp in the Midland Basin and Bone Spring and Wolfcamp in the Delaware Basin. Other figures are included to provide the basin framework during the ages, tectonic framework, and stratigraphy presented.


The concept of a basin existing under the expansive deserts of West Texas and southeastern New Mexico only become apparent through speculation from fieldwork and evaluation of water well cuttings during the mid-1910–1920 decade. The West Texas Basin presence was not proven and defined until drilling for hydrocarbons during the 1920s. The first economic subsurface exploration and development after water was for potash. Potash was needed by the United States (mid-1910s) for crop fertilization, having lost supply from Germany during the European War[6] later to become the Great War, and by the mid–twentieth century known as World War I. Even the Santa Rita #1 in the Big Lake Field was evaluated for its potash potential above 2000’ subsurface before being drilled deeper and discovering oil at a total depth of 3050’ (MD).
The first economic oil discovery in the basin was during 1920 at the Westbrook Field. Since then, the basin has produced 28.9 BBO through 2019 and 203 TCFG through September 2018 [3][4][5][7][8][9][10]. Six (6) BBO and 17.5 TCFG have been produced from unconventional resource reservoirs through March 2020; most of that in the past five years[11]. Several unconventional resource exploration discoveries and field development in the West Texas Super Basin are described in this chapter. This chapter refers to the West Texas Basin as Udden[12] first referenced it and Van Waterschoot van der Gracht[13], Ver Wiebe[14], and Powers[15], and more recently by King[16], Ewing[17][18], and Fairhurst et al. [10] representing the entire area, tectonic history, and stratigraphic units from Cambrian through recent. The West Texas Permian Basin will be explicitly referenced to the geologic record and stratigraphic units of that System (Permian). The current image for most of the West Texas Permian Basin (Figure 1) is only valid and developed during the Late Mississippian through the Permian into the Triassic. Throughout most of the West Texas Basin geologic history, it had a much different basin architecture controlled by a varied tectonic development, sedimentary processes, stratigraphic events, and many other controls on understanding the petroleum systems. For these reasons, the West Texas Basin nomenclature is preferred. The more recent nomenclature as the West Texas Super Basin is defined by Sternbach[19] and Fairhurst et al.[10]
The tectonic history, related basement, and sedimentary/stratigraphic sequences important in understanding the petroleum systems in the West Texas Basin.[10][20] are defined during several stages of development: (1) Proterozoic basement foundation 1700–980 Ma[17]; (2) Cambrian rifting [21][22][23]; (3) Ordovician to late Mississippian subsidence forming the Tobosa Basin[24] similar to other Paleozoic intracratonic basins[18]; (4) Late Mississippian to Early Permian Ancestral Rocky Mountain[10] (ARM) and foreland basin subsidence and deformation[25]; (5) Early Permian to Late Permian subsidence; (6) Cretaceous uplift and sedimentation; (7) Late Cretaceous through Oligocene extension; and (8) Oligocene volcanic and heating affecting the western and southern parts of the Delaware Basin and basin tilting to the east. These are reviewed here only concerning the discussion of the unconventional resource reservoirs discoveries and development made during the past two decades (2000–2019).
Although several hundred or more completions were made or attempted during previous decades in what is now defined as unconventional resource plays in the basin, most were uneconomic, isolated events. They were completed as secondary, backup, bailout efforts when shows were identified during drilling; evaluation; after the primary, conventional targets were defined as unsuccessful; or when multiple zones (conventional and unconventional) were comingled. Several source rock, tight migration pathway, and transitional reservoir lithologies, now the oil and gas industry unconventional resource targets, were known throughout the West Texas Basin as all show, no dough. These stratigraphic units typically had good shows because of the higher pressures caused by the maturation of organic material to hydrocarbons, especially in source rocks but were quickly depleted when pressure was equalized to normal hydrostatic pressure in the near-wellbore environment. The exploration discoveries of unconventional resource reservoirs focused on unconventional resource concepts, systematic continuous investment in discovery, development, and enhanced recovery from these unconventional reservoirs.
Unconventional resource plays are defined in several ways. Most of the industry and general society, the benefactors of the oil and gas industry discoveries and advancements, consider any horizontal well using hydraulic fracture stimulation to recover the hydrocarbon resources as an unconventional resource play. Geologically, we can define these somewhat more generically as four types: source rocks, transitional reservoirs, hybrid, and migration pathway plays. These are penetrated most commonly by vertical wells, later by horizontal wells, and hydraulic fracture stimulated to improve investment recovery and economic outcomes. The densest and highest concentration of hydrocarbons in unconventional resource plays are typically found in source rocks. Examples of unconventional resource play source rocks such as the Wolfcamp and Woodford are located in the West Texas Basin. The Eagle Ford, Niobrara, Barnett, Haynesville-Bossier, Fayetteville, Marcellus, and Utica are other source rock, unconventional resource reservoirs. Unconventional resource plays can also be transitional from the source rock, low porosity, and low permeability to conventional reservoir porosity and permeability. These are typically proximal to quality source rocks and have enhanced recovery because of high-density hydrocarbon concentration when found in traditional geologic traps. Transitional plays are less economic when exploited in the productive but lower density hydrocarbon and higher water cut, a more regional part of these transitional plays not within traditional geologic traps. Examples include the Bakken, Three Forks, Austin Chalk in places, Meramecian and several other mid-continent plays, and several Leonardian plays like the Spraberry in the Midland Basin and Bone Spring in the Delaware Basin. In these transitional reservoirs, production rates and total recovery benefit from horizontal drilling and hydraulic fracture stimulation.
Transitional reservoirs are different than what has been defined as hybrid plays. Hybrid plays are interbedded fine-grained source rocks with higher porosity and permeability conventional reservoirs[26][27][28]. The interbedded conventional and unconventional reservoirs can make excellent horizontal and fracture stimulation targets with shales contributing hydrocarbon source and storage with conventional reservoirs enhancing productivity. Finally are migration pathway plays or carrier beds[29]. These unconventional resource plays, including the Mississippian Lime and several other mid-continent unconventional resource plays, other than the Woodford, have low-density hydrocarbon concentration and, typically, high-water productivity. These hydrocarbons have been expelled from the source rock and are trapped in fractures and transitional reservoirs (lower porosity and permeability) along a migration pathway.
An excellent example of a transitionally trapped reservoir versus regional migration transition play is the Bakken. After more than 20 years of exploration and development, the best Bakken production throughout the Williston Basin can be found using Meissner’s[30] paper defining the Bakken source rock potential (upper and lower Bakken, not the middle Bakken reservoir). The defined geologic traps (structural, stratigraphic, combination, and geochemical) are illustrated and summarized in Meissner’s[30] work. These include Antelope Field, fracture development over a basement fault/flexure, Nesson anticline structure; Elm Coulee, a stratigraphic pitchout trap on the southwestern part of the basin; and the eastern part of the play, trapped by a porosity/permeability pitchout developed by thermally mature liquid hydrocarbon with associated porosity in kerogen in the process of conversion to oil verses updip nonthermally mature kerogen in a nonporous, nonproductive mudrock. Examples are the Sanish and Parshall Field areas. Superior economic results, and therefore financial investment, are in the densest hydrocarbon concentrations, source rocks, and these transitional reservoir geologic traps. Less-economic outcomes are obtained when the Bakken is targeted in the productive but lower density hydrocarbon and higher water cut, the regional part of these transitional plays not within traditional geologic traps.
Other unconventional resource plays are being made in the regional (untrapped) part of transitional plays. These migration pathways contribute to production from the general category of unconventional resource plays but are less financially and economically successful[31][32]. The West Texas Basin unconventional resource reservoirs include examples of each; several are defined and described.
Discovery and economic development of the West Texas Basin unconventional resources are tied to Texas’s earliest history as a nation and state. Early geologic studies and reports concerning West Texas before understanding a basin presence under the desert plains of West Texas and southeastern New Mexico are essential in understanding unconventional resource discovery and development. The West Texas Basin remained undiscovered for decades after the first geological studies of West Texas.
Unconventional resource discovery and development in the basin is also associated with the first commercial discoveries of oil in conventional reservoirs in West Texas approximately 90 years earlier. Before 1920 the basin was defined in only elementary geologic concepts from fieldwork and reports by the University of Texas Mineral Survey (later to become the Bureau of Economic Geology), formed immediately after the Spindletop discovery. Spindletop and its economic promise ignited geologic fieldwork, review, and oil and gas exploration activity throughout the state first by the University of Texas Mineral Survey, then by the oil and gas industry[12][33][34][35][36][37][38][39][40][41][42][43][44][45][46]. The work of Udden[36], Beede[39], Liddle[41], and Liddle and Prettyman[42] at the Bureau of Economic Geology and Technology lead to the first significant map, the Marathon fold theory and map, for exploration of the West Texas Basin[47].
Geologists did not have much subsurface data and information or not much-recorded subsurface data and no deep wells to assist in their interpretations before the mid-1920s. Because Cretaceous strata cover much of the basin, especially the east side, mapping Cretaceous horizons and structures became the focus of many field crews, including Marland Oil Company and one of their young geologist, Phillip B. King. During the mid-twentieth century, King became a leading researcher and expert on the relationship between tectonic setting and stratigraphy in this basin and throughout North America.
Gulf geologist O. C. “Kip” Harper developed a new concept during 1924 to unlock the West Texas Basin buried structures. Through 1924, Gulf’s lease map (Figure 3A) looked much like the efforts described by others and those trying to catch up to independent oil companies’ successful work in West Texas. Most of the leases are coincidental (or not) with the reports of Udden et al.[37] on or as close to the Marathon fold theory maps and around the only two fields discovered and shown at that time (Figure 3A): Westbrook (northeastern Mitchell County) and Big Lake (southwestern Reagan County).

As stated by Powers[15], “[T]he Lower Cretaceous was deposited on a peneplained surface by progressive overlap [over the Triassic] . . . the Triassic rest uncomfortably on the uppermost Permian and is approximately parallel to it structurally” (p. 1113). What Harper and others at Gulf recognized after Udden[12] was that the thickness of the upper Permian salt and evaporate red beds may be the key to unlocking the structure of the basin and Permian carbonates. Where the red beds were thin, the Permian carbonates would be structurally higher, and where the red beds were thick were the lower structural positions in the Permian carbonates[16]. So Harper, after Udden[12], obtained as many drillers (mostly water well) log descriptions as possible and made isopach maps of those red beds (Figure 3B). This red beds map then became, sequentially, the second most significant map for exploration and understanding of the West Texas Basin.
Gulf Oil switched their leasing strategy to the red bed isopach thins and held the acreage shown in Figure 3C, which would soon be recognized as the Central Basin Platform[10] (Axis). The 1926 lease map (Figure 3C) shows Westbrook (1920) and close by Ira field (1923) to the north and Iatan-East (1925) fields west of Westbrook. Both Big Lake (1922) and southern offset World (1925) fields were the other areas of concentration for Gulf Oil through 1924. Gulf Oil had acquired 300,108 acres for an average cost of 45 cents an acre on the Central Basin Axis during 1925[48]. Seventy percent of that acreage was from nine leases. The 1926 lease map includes six discovery wells on the Central Basin Axis from the 1925 McCamey, 1926 Yates, and other fields. More than half of those wells were on Gulf acreage or where Gulf had the controlling offset acreage position.
Harper et al. at Gulf[48] thought they had found the largest anticline in the world[48]. Others[50], like King[16], considered the high as “a nearly solid sequence of limestone down to basement rocks. . . . Amazingly, as has happened with many other great scientific discoveries, nearly every geologist who was working in West Texas came independently to the same conclusion at about the same time, by 1929 the ‘reef theory’ as an explanation of the Permian stratigraphy of the region” (p. 37–38) and recognized the parts of the Delaware Basin, Midland Basin, and Central Basin Platform/Axis (Figure 1).
As the number of penetrations below the Ochoan into the Guadalupian section for oil increased, the upper Guadalupian, typically Capitanian Yates (Figure 2A) sandstone, became a regional structural mapping horizon. Twenty-five feet of closure on the Yates sandstone provided evidence of a lower closure and was prospective for drilling. The transgressive Yates sandstone on the shelf prograded over the progressively prograding shelf carbonate ramps and rim margins of older Guadalupian reservoirs and traps[51].
There were field discovery peaks in 1926 and 1929, and the West Texas Basin field discovery peak year was 1937 (Figure 4). Multiple discovery subpeak years occurred during and immediately after the World War II, with 1957 being the last year, which had cumulative reserve discoveries of 500 MMBO or more from conventional reservoirs.

Seventy-four percent (74%) of the cumulative production in conventional reservoirs are from Permian age reservoirs (54% from Guadalupian Series) and 26% from Ordovician, Ellenburger, through upper Pennsylvanian age reservoirs. Seventy-four percent (74%) to 75% of the production is also from carbonate reservoirs, with the remaining 25% from siliciclastic or mixed carbonate and siliciclastic reservoirs. These reservoirs are concentrated on the Northwest Shelf, Central Basin Platform, basin margins, and several large structures in the deeper Delaware and Midland Basin[3]. Most are shallow-marine shelf to shelf-margin carbonates[3][24][52]. Significant economic and technical discoveries and developments in conventional reservoirs and fields assist with the geologic understanding, later discovery and development of unconventional resource reservoirs, and general understanding of the West Texas Basin. With these discoveries, background, and broad knowledge of the basin ((Figures 1, 2, 3), the West Texas Basin was no longer the Petroleum Graveyard of Texas, and we jump only 14 years from understanding the gross basin architecture in 1929 to the identification and potential of unconventional resource reservoirs throughout the basin.
Exploration, Discovery, and Economic Development of Unconventional Resource Reservoirs in the West Texas Super Basin[edit]
The World’s Largest Uneconomic Oil Field[edit]
Seaboard Oil Company drilled the Abner J. Spraberry #1 in eastern Dawson County during 1943. The well had traces of oil in the newly defined Spraberry interval ((Figure 2A) named after the rancher and lease owner. The Spraberry was noted as a potential producing formation, but no commercial amounts of oil were produced. In 1949 Seaboard drilled the #2D Lee into the Spraberry, shot the well with nitroglycerin, resulting in the initial production of 319 BOPD. That discovery did not appear to bring much attention as the giant Horseshoe atoll extension and development continued in the northern Midland Basin (Figure 5). The following year (1950), Spraberry discoveries were drilled in Borden County to the northeast of the Lee well and in Midland and Upton Counties up to 65 miles to the south, kicking off a leasing and drilling frenzy[53] in the deeper part of the Midland Basin. Continuing into the early 1950s, it appeared that almost every well drilled into the Spraberry (Spraberry North, Spraberry Trend, and Dean) over several counties was productive.

The Spraberry in the northern Midland Basin is a conventional sandstone reservoir (Spraberry North, Figure 5). The Spraberry trend, a larger area to the south, is a transitional unconventional resource reservoir. The Spraberry trend reservoir has lower porosity and permeability, it is a fine-grained sandstone to siltstone, and production abruptly declined to subeconomic rates. The Leonardian and Spraberry/Dean are subdivided into an Upper and Lower Spraberry and Dean (Figure 2A). The siliciclastic, very fine-grained sandstone and siltstone reservoirs are interpreted as a submarine, basin-floor fan complexes deposited by debris flows, turbidity currents, slumps, and suspension[3][52][56]. These interconnected fans formed an area approximately 75 miles long, north–south, and 35 miles wide, east–west, covering 2500 square miles. The updip limit is the north–northeast sediment source area truncated by the Leonardian shelf margin. The regional Spraberry Trend is not a conventional, standard reservoir and geologic trap. It is a transitional, very fine-grained, unconventional resource reservoir to shale unconventional resource play. It is a basin-floor, fine-grained, fractured, hydrocarbon-saturated reservoir with tight porosity and permeability. This makes the Spraberry Trend the first unconventional resource play in the West Texas Basin. Exploration and extensive development of the reservoir occurred decades prior to the unconventional resource reservoir terminology now common throughout the oil and gas industry. Production followed a similar, now recognized, trend of high initial rates and rapid declines. Secondary, waterflood recovery efforts started during the early 1950s were economically unsuccessful because of the limited, tight reservoir conductivity between wells. Horizontal drilling in the 1980s also proved to be economically unsuccessful[56]. Thus, the play became known as the World’s Largest Uneconomic Oil Field.
Several, mostly small, independents primarily from Midland did have economic success. They seemed to be companies focused first on geology, then reservoir engineering, finally financing. They played the more promising targets versus the more general productive outline of the regional play[57]. These groups realized that the combined technical expertise and selective investment could lead to a limited but sufficient economic return. Many failed. Through 2000, the Spraberry/Dean submarine-fan sandstones had produced 1.3 BBO[3][11]. Whether considered a tight conventional play or one of the first transitional, regional resource unconventional plays, there were important technical and financial lessons similar to other unconventional resource reservoir plays discovered and developed after the World’s Largest Uneconomic Oil Field.
Discoveries commonly require multiple testing, learning, application, and investment over time rather than being an instantaneous moment of discovery.
With more than 500,000 wells drilled in the West Texas Basin, several hundred or more completions were made or attempted for decades in what are now defined as several unconventional resource plays. Most were uneconomic. The exploration discoveries of unconventional resource reservoirs defined here are the more focused efforts on unconventional resource concepts, systematic continuous investment in discovery, development, and enhanced recovery from these unconventional reservoirs and later development by a larger number of early adaptors and industry followers.
Discovery of the Wolfberry (combined names of Spraberry and the underlying Wolfcamp) in the Midland Basin was completed by a network of individuals across time, several different companies, and outside events. The primary external event during the late 1990s into the early 2000s was low oil prices. The commoditization of oil (reduced price from oversupply) reduced or, in many cases, destroyed producers[58]. It also provided an opportunity. At that time, the opportunity was industry consolidation, especially among major oil and gas companies in merger mania. In 1998, BP merged with Amoco; in 1999, Total merged with Elf, and Exxon purchased Mobil; in 2001, Chevron purchased Texaco; and in 2002, Conoco merged with Phillips[59]. In the year skipped in the sequence, 2000, BP Amoco purchased Atlantic Richfield Company (ARCO).
Before being acquired, during the mid–late 1990s, ARCO went on a 300 well drilling, completion, and production spree in the Spraberry play reportedly to convert 3–5P (3P = PUD, Proven Undeveloped; 4P = Probable; 5P = Possible reserve categories) to 1P (PDP = Proven Developed Producing) reserves. Moving reserves up the system, lower reserve categories (higher numbered 3–5P) to higher reserve categories (1P), increases the value of a company’s reserves, and, therefore, its value. Near the end, ARCO used a larger rig and drilled through the Spraberry into the Wolfcamp immediately below. The engineer working the Boultinghouse lease where most of these wells were drilled was Dennis Phelps. After several attempts to complete the Wolfcamp using completion strategies and methods similar to the Spraberry completions, the Wolfcamp had typical results; some shows no significant, sustained production. The Spraberry completions were typically larger sized sand proppant, lower volumes of fluid with high viscosity cross-linked gels pumped at a low rate to carry the proppant down the wellbore into the reservoir.
In the Boultinghouse 11-7 well, Phelps was ready to try something new and pumped completions into the Wolfcamp, much like George Mitchell completed the Barnett Shale wells with less vicious, slickwater, and lower sand concentrations[60][61]. Multiple stages were completed in the Wolfcamp, comingled with several zones in the Spraberry. They knew from the oil color, a golden green, not brownish oil, that the initial 300 BOPD production was primarily from the Wolfcamp. The rate was significantly better than most of ARCO’s and other operators’ typical Spraberry wells. As usual, production declined but not as abruptly as previous Wolfcamp attempts. Phelps and ARCO made several other attempts on the lease, none as successful, but these were the first indications that they may have been developing a new play. This was the first glimpse into what this play would later become. During 1999, in the process leading up to the closing of the BP Amoco–ARCO acquisition, it became known that the BP Amoco would not be continuing new investment in the low-rate production in West Texas but focusing on higher rate production offshore GOM and international. So Phelps decided to retire, moving to East Texas to become an oil and gas consultant.
Now merged, BP Amoco later farmed out a part of their Spraberry position to CMS Energy, a Michigan Independent, to drill some of the Spraberry Field wells. After nonstellar returns, Danny Campbell with CMS Energy approached the president of Henry Petroleum, Dennis Johnson, to seek financial assistance to drill 14 wells just south of the Boultinghouse leases they had farmed-in from BP Amoco. Dennis Johnson’s network included Dennis Phelps[62]. Phelps had discussed the Boultinghouse results with Johnson before he left Midland for East Texas, and later Johnson convinced Phelps to return to Midland to consult with him at Henry Petroleum. With Phelps’ knowledge, Henry took the opportunity from CMS and brought in Pure Resources as a three-quarter partner. Phelps designed the Wolfcamp completions using the methodologies developed during his tenure at ARCO[61].
Henry’s geologist, Dave Feavel, developed a trend play in the more porous updip part (proximal debris flow apron) of the Wolfcamp on the Midland Basin western margin immediately east of the sediment source, the eastern margin of the Central Basin Platform. There the discovery well for the Sweetie Peck Field was drilled and completed (Figure 6B). At these localities, shelf carbonates on the Central Basin Platform were deposited as coarse-grained, proximal debrites and turbidites that later slumped into the western Midland Basin slope as large fault blocks. Between the more distal carbonate debris and turbidite flows, organic-rich siliceous and basin-floor sediments were deposited. These silica-rich, organic facies increased from the basin margin into the basin (Figure 6B), forming the intraformational source rock within the Wolfcamp. With this model, Feavel carried the play another 17 miles to the south and drilled a look-alike to Sweetie Peck in the Beverly #1, which became the discovery well for the Chickadee Field[61].

Conventional reservoirs in the Wolfcamp have been discovered in toe-of-slope, basinal carbonates with better reservoir facies in bioclastic grainstone channelized facies in Powell Ranch discovered in 1977; Garden City Westfield (1960) and Blalock Lake Field (1966) in Glass-cock County, eastern Midland Basin[64][63]; and Tokio South Field in Yokum County in the northern Midland Basin[65]. These fields provide necessary technical information for depositional models and production for later discovery and development of the basinal unconventional resource reservoirs but are conventional reservoirs, not the focus of these unconventional discoveries defined in this chapter.
From 2000 through 2010, the Wolfberry was still a vertical well play. Van Temple, Henry’s operations manager, is credited with coining the term Wolfberry being tired of saying Spraberry–Wolfcamp[62]. With experience, the vertical wells were being completed with an increasing density of fracture stimulated stages, increased cluster spacing within stages, higher rate (pump rate) for the improved initial production, and better long-term productivity (Figure 6A). Eventually, in the early 2010s, the wells were drilled in the deeper basin in finer grained, tighter porosity and permeability source rock and were drilled horizontally. Once Henry had developed and proven the play internally, they started a lease program and were able to lease 300,000 acres before others in the oil patch knew what they were doing. They were considered crazy for leasing so much acreage in a basin with declining production[61]. However, having defined the play, Henry’s partner Pure Resources sold to Chevron; later, during 2008, Henry sold to Concho for $584 million.
From 1950 to the 1990s, there were 27,114 vertical wells drilled into the Spraberry north, Dean, and Spraberry Trend plays in the Midland Basin (Figure 5). The first 12 horizontal wells were drilled in the 11 years between 1990 and 2001. No horizontal wells were drilled between 2002 and 2006 and six drilled from 2007 to 2010<reef> Blomquist, P. K., 2016, Wolfcamp Horizontal Play, Midland Basin, West Texas: AAPG Search and Discovery Article #10890, 34 p.</ref>, with the trend moving from Sprayberry horizons to upper Wolfcamp intervals. Fifty-seven horizontal wells were drilled in 2011 with a peak of 1020 horizontal wells in 2014 when product prices started to fall gradually by midyear before an escalated drop in prices at the end of 2014 into 2015. By the end of the first quarter of 2020, 8795 horizontal wells had been drilled in the Midland Basin Wolfberry play. Eighty-one percent (81%) have been drilled in the Wolfcamp (7105) with 19% in the Spraberry/Dean (1690). Fifty-seven percent (57%) of the Wolfcamp wells are in the Wolfcamp B (4042); 37% in the Wolfcamp A (2613); and only 6% in the Wolfcamp C and D. Forty-six percent (46%) of all horizontal wells in the Midland Basin have been drilled into the Wolfcamp B (F. Male, 2020, personal communication).
Necessity is the mother of innovation and opportunity in the Delaware Basin. During the mid-2000s through 2009, Eagle Oil & Gas Co., a Texas Independent, made a capital expenditure of approximately $70 MM drilling geologically successful, subeconomic wells in south Texas and the southern West Texas Basin. Eagle’s 40,000–50,000 acres in the West Texas Basin were scattered over Reeves, Pecos, and Ward Counties in the southern Delaware Basin, southern Central Basin Axis, and deep Sheffield Channel (Figure 1). Their objectives at that time were conventional reservoirs in Pennsylvanian sandstones on the margin of the Central Basin Axis into the Sheffield Channel, Wolfcamp C sandstones sourced from the Diablo Platform filling the western margin of the abruptly subsiding southern Delaware Basin (Figure 7B, C), and Third Bone Spring sandstones in central Reeves and southern Ward Counties (Figure 8).
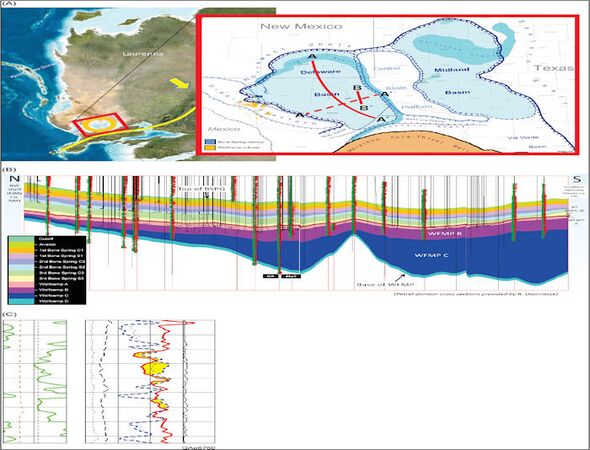
Figure 7 (A) Blakey reconstruction of the West Texas Basin during Middle Permian and cross-section locations in the Delaware Basin. (B) Cross section A-A’, north to south showing the low-stand, stratigraphic interval, Wolfcamp C in blue. A similar geometry from west to east (dashed line) occurs as represented on the southern half of cross section A-A’. (C) Gamma Ray–Density-Neutron log across the Wolfcamp C showing a representative sandstone, 9’ thick, 14% average porosity with good Neutron–Density crossover. Darker horizontal lines indicate 10’ of depth separation; lighter horizontal lines show 2’ depth separation. 7A and 7B modified from Carr[66].
Figure 8 Third Bone Spring sandstone. (A) Third Bone Spring sandstone Type Log showing Hoban, A, and C sandstones (B sandstone is not developed at this type log location; D/E not illustrated). (B) Cross section B-B’ is located from central Reeves County on the south to southern Ward County on the north (see location on the map, (Figure 7A). The Hoban, A, and C sandstones are well developed on the south end of cross section B-B’ in central Reeves County, and there are no lower sandstones D/E to the south. The upper sandstones pinch out to the north in southern Ward County, but the lower sandstones D/E are present immediately above the Wolfcamp Shale (stratigraphic cross section B-B’ is hung on the red line, Bone Spring–Wolfcamp contact). Cross section B-B’ modified after Masterson[67].


Cross section A-A’ (Figure 7B) is north–south through the center of the Delaware Basin. It is hung on the top of the Bone Spring formation showing the Bone Spring and Wolfcamp filling the abruptly subsiding Delaware Basin. The Wolfcamp C (blue) is the thickest, onlapping basin-filling, low-stand stratigraphic interval. In southern Reeves County, the Wolfcamp C thins dramatically onto the Diablo Platform (Figure 1, Figure 7A), and a dashed cross section (A-A’) is illustrated, showing a similar geometry as displayed on the southern part of cross section A-A’. Wells that penetrate the Wolfcamp C closer to the Diablo Platform are up to 75% sandstone with high resistivity and typically have 5–10 ft flairs while drilling (Figure 7C). To the east into the basin, farther from the source, the sandstone percentages decrease, but the reservoir quality, resistivity, and 5–10 ft flairs are consistent, with an increased or uniform thickness of the entire interval. Where productive, these sandstone reservoirs and older, Pennsylvanian sandstone reservoirs produce 1 BCFG per foot from conventional reservoir porosity.
Eagle’s other play before 2010 was drilling horizontal wells in the Third Bone Spring sandstones (Figures 2A, 8). The Third Bone Spring sandstone Type Log section (Figure 8A) shows the Hoban, Third Bone Spring A, and Third Bone Spring C sandstones. The B and D/E sandstones are not developed at the location of this type log. The geologic parameters of these sandstones are the same where each is best developed. These parameters are 10’–14’ thick with 12%–14% porosity and similar oil saturations. The horizontal wells were drilled to increase kH and were completed with modest sand fracture stimulations using 20/40 mesh sand proppant, pumped at relatively low, 40–50 barrels of fluid per minute rates typically with cross-link gels. Results from south to north were quite variable. The wells in Reeves County (east of the Pecos townsite, south end of cross section B-B’, Figure 8B) were relatively low initial production rates and very low, subeconomic outcomes. The wells just south of the Pecos River in Reeves County (center of cross section B-B’) had better IPs but still had low EURs, which will not payout. The wells to the north in Ward County (northern part of cross section B-B’) had moderate IPs and successful economic outcomes.
The last well Eagle Oil & Gas Co. drilled in Reeves County during 2009 and the first two wells in 2010 are shown on the map in Figure 9B by the three red circles. These wells were drilled for Wolfcamp C sandstone objectives and Third Bone Spring sandstone potential. The last well of 2009 is the northern well, the Eagle Oil & Gas Co., Sheldon #1. It was drilled 1000’ into the Wolfcamp C and had 75% sandstone, good porosity, high resistivity, and a 5–10 ft flair throughout the drilling of that interval. This vertical well was completed in eight stages: three in the Wolfcamp C sandstones, one in the lowest part of the Wolfcamp shale, one in the top of the Wolfcamp shale, one in the Third Bone Spring sandstone, and two in the Second Bone Spring. It produced mostly water, some oil, and some gas. One noteworthy observation made in the upper middle Wolfcamp Shale circled red on the log (Figure 9A, now identified as the upper Wolfcamp B). That interval put oil in the pits. Again, “all show, no dough"! It was interpreted as an isolated fracture that would have been quickly depleted as occurred in almost all source rock completions and was not completed.

The first well of 2010, the Eagle Oil & Gas Co., Pistola 186 #1, was the western of the two wells about 10 miles to the south of the Sheldon #1 and on strike both structurally and depositionally with the Sheldon well. It had very similar drilling and evaluation results. The well was completed with a four-stage completion only in the Wolfcamp C sandstones. There it produced large volumes of water with some gas. The one noteworthy observation made was in the upper middle Wolfcamp Shale (now identified as the upper Wolfcamp B) at the same stratigraphic interval as the Sheldon well 10 miles to the north, a 2–3 ft drop in the Neutron and Density log put oil in the pits. The lithology at that same stratigraphic interval was a more basinal, organic-rich siliciclastic rather than the carbonate debrite in the Sheldon well. Again, an “all show, no dough” conventional, not unconventional shale play mentality prevented the consideration of completion but a second note that seemed too coincidental.
The next well, Eagle Oil & Gas Co., Bell 213 #1, was just over a mile to the east. At the same stratigraphic interval (upper Wolfcamp B), there was not only a little oil in the pits but the well flowed oil consistently, and the mud log showed a much thicker oil-saturated interval. Once open-hole logs were obtained (Figure 10), the 1–3 ft interval interpreted to be a fracture in the first two wells was a 20–30 ft, organic-rich, siliceous shale. One and a half miles into the basin rather than along strike made a tremendous difference in the amount of organic-rich, productive reservoir facies. This was immediately interpreted as a new play, the unconventional Wolfcamp resource reservoir similar to that previously defined by Henry in the Midland Basin. The well was completed with six stages: three in the Wolfcamp C sandstones, one in the new target zone in the upper middle Wolfcamp Shale (Wolfcamp B), and two in the upper shale (Wolfcamp A) and Third Bone Spring sandstone.

There had been other completions in the Wolfcamp shales in the Delaware Basin previously when excellent shows were observed. Most were uneconomic, isolated events. They were completed as secondary, backup, bailout efforts when shows were identified during drilling; evaluation; after the primary, traditional target was defined as unsuccessful; or when multiple zones (conventional and unconventional) were comingled. These stratigraphic units typically had good shows because of the higher pressures caused by the maturation of organic material to hydrocarbons but were quickly depleted when pressure equalized to normal hydrostatic pressure in the wellbore and near-wellbore environment. The difference with Eagle Oil & Gas Co. completion of the Bell #1 and exploration discovery focused on unconventional resource concepts, systematic continuous investment in discovery in subsequent wells, development, and enhanced recovery of the unconventional Wolfcamp reservoir and produced hydrocarbon reserves.
The challenge then was to provide a clear vision that a more focused effort on unconventional shale resource concepts, systematic continuous investment in discovery, development, and enhanced recovery from these unconventional reservoirs and abandonment of the geologically successful but subeconomic strategies focused on the Wolfcamp C sandstones, Pennsylvanian sandstones to the east, and good results but technically challenging and high capital cost of the Third Bone Spring horizontal conventional play.
Another critical element in understanding and concepts was the Third Bone Spring wells, which had not previously been processed or documented. The wells drilled in good sandstones with good oil saturations to the south were in the Hoban and A sandstones, which pinch out to the north. The wells near the Reeves–Ward County line were in the middle C sandstone until it pinches out to the north and the better economic results to the north were in the D/E sandstones present immediately above the Wolfcamp Shale (cross section B-B’, Figure 8B). Those sandstones are not present farther to the south.
The Wolfcamp Shale is high pressure because of the maturation and conversion of organic material (kerogen) to hydrocarbons. Those hydrocarbons are trapped in an increasing pressure, which is periodically released by fracturing the host rock and migration into the most proximal conventional reservoirs. Examples and experience from other areas with stacked reservoirs in a single trap, south Louisiana, offshore Gulf of Mexico, and internationally, it was known that the best production is typically the first reservoir above the induced pressure formed by the maturation of organic material to oil in the source rock (Figure 11). In this case, the Wolfcamp Shale provided the source, and the Third Bone Spring D/E sandstone being the first reservoir above the source rock. Lower recovery rates and lower EURs occurred vertically farther from the source rock in the Third Bone Spring C, B, and A. It all fits into an excellent complete explanation and a new exploration objective, the Wolfcamp shale source rock, unconventional resource reservoir.

The new concepts hung on the ± 1000 ft of shale potential that was not the target of the conventional plays both above and below the Wolfcamp Shale (now identified as the Wolfcamp A and B). An isochore map of the Wolfcamp Shale below the Third Bone Spring to the top of the Wolfcamp C was constructed (Figure 12A) to define the Wolfcamp Shale potential and better potential reservoirs. Once complete, it was immediately determined that this isochore map was the key to the play. The interpretation was that the 1000’ thickness of shale defined the depositional basin floor. At the points, a contour line, the shale began to decrease in thickness to the west and south (the southern interpretation is not shown in Figure 12), representing the base of depositional slope, basin-floor contact. The thickness uniformly decreased from 1000’ thick to 650’ at a rate of 100’ per mile, interpreted as a consistent angle depositional slope. Together with the knowledge that wells drilled through the Wolfcamp Shale on the now-defined basin floor, actually several miles into the basin floor from the slope to basin-floor contact, put oil in the pits, it was higher pressure (the “sweet spot”). Wells on the lower slope had oil shows but not the pressure to flow oil into the pits, and wells farther up the slope flowed gas. At the time, it was interpreted that the best hydrocarbon development, reservoir, and trap was developed in the relatively flat-lying basin-floor strata. Lower-quality hydrocarbon generation and development, reservoir, and trap with decreased lateral seals occurred in the steeper dipping slope environments to the west and south.

Later work by the Tight Oil Resource Assessment (TORA) Industrial Consortium at the Bureau of Economic Geology determined that many of the gas-prone productive areas in the Wolfbone and Wolfberry are oil reservoirs that have been significantly uplifted. As a result of Laramide through Oligocene and later uplift, tilting of the basin to the east, and erosion, hydrostatic pressure is lower in these reservoirs than in the original deeper setting. They are near, at, or below the bubble point and produce mostly gas. In some areas, including the western and southern Delaware Basin near the Diablo Platform and the Davis Mountains, high heat flow during the emplacement of Oligocene and younger volcanics may contribute to higher thermal maturity and gas production[69][70]. Additionally, poor reservoir quality results in an instantaneous gas phase with the reservoir only storing the most recent, mature hydrocarbon phase because of the reservoir’s limited storage capacity[71][72].
Once the gross shale (Wolfcamp A and B) interval was mapped, the focus shifted to individual horizons within the Wolfcamp A and B. The model was that the basin-floor depositional system contained the organic-rich, silica-rich, very thinly bedded basinal facies with shelf carbonate debris flows into the basin. Very different interpretations of the Wolfcamp were made, depending on what part of the depositional systems within the basin the geologist were most familiar. In outcrop in the Glass Mountains along the southern margin of the West Texas Basin and the Guadalupe Mountains on the basin western margin, the Wolfcamp is dominantly shelf carbonates with minor interbedded siliciclastic shales. The basin center is dominantly the in situ thinly bedded siliciclastic, organic-rich mudstones with the allochthonous shelf carbonate debrites and turbidites. In the Wolfcamp B, the allochthonous carbonates were debrites with coarse shelf clasts in a lime matrix and were easily identifiable in cuttings and imaging logs (Figure 13). These commonly massively thick (>100’) agglomerated units contained very little organic material. It was interpreted that shelf carbonate gravity flows would continue down the constant angle slope until hitting the basin floor (red line on Figure 12B, 13B), then deaccelerate, depositing the sediment load.

Mapping several of these individual units helped determine the three-dimensional framework of the various units and potential future targets and which to avoid (Figure 13B). The geometries assisted in confirming the slope to basin-floor model in Reeves County. In the Wolfcamp A and B, the siliciclastic facies were very similar; the carbonate facies were very different. In the A, the carbonates were much more dominated by thinly bedded and finer grained turbidite facies with only two debrites at a relatively consistent stratigraphic position in the lower A. These appeared to be much deeper water or distal environments or both than the Wolfcamp B carbonates. They were also more uniformly interbedded with the deep basin, organic-rich, silica-rich, thinly bedded source rock lithologic facies. Imaging logs also helped to understand the natural fracture patterns, genesis, and predictability of fracture for various intervals (Figure 14). The dominant fracture orientation strikes at 120 degrees, dipping at 85 degrees both to the northeast and southwest (Figure 14A) and are very consistent vertically and horizontally over this area of Reeves County. The fractures were dominantly observed in the organic-rich, thinly bedded, silica-rich facies cutting across bedding plans, absent or infrequent in the debrites in the Wolfcamp B, and more frequent in the turbidities in the Wolfcamp A. Given that these imagining logs were collected in vertical wells with observed fracture plans dipping at 85 degrees, it was surprising how many fractures could be identified. In several of the more organic-rich, mostly silica-rich facies, a shear set (60 degrees) from the regional and horizontally consistent 120-degree orientation (north 60 degrees east) were observed (Figure 14B).

Given that fractures were associated with the organic-rich facies, increased upward in the source rock, and were near vertical, the fractures were determined to have a geochemical origin. These were formed during the maturation/generation process from kerogen to hydrocarbon. The chemical cracking of organic material during generation expands as hydrocarbon is generated. The hydrocarbon expansion causes pressure increases of several thousand pounds and geologically fractures the brittle source rocks, much like the engineers were doing artificially during completion.
Understanding the stratigraphic variations, depositional processes, mineral facies, source rock potential, and reservoir potential emerged from the vertical well program. Most significant in this understanding was the multiple, organic-rich, high-hydrocarbon density shales in the basin-floor setting. A single organic-rich, “hot” gamma ray shale is found basinwide between the Wolfcamp A and B shales (Figure 15). Similar to other shales in the deep, basin-floor environment, this shale was more continuous and more universally present correlated and found in multiple depositional environments from the southern upper slope and shelf environments in the southern Delaware Basin near Balmorhea just north of the Davis Mountains to the shelf environments near Lubbock in the northern Midland Basin and deep, basin-floor environments in the Midland Basin. It was identified as a regional condensed shale, the maximum flooding surface (mfs) for the Wolfcamp. This shale then defined the organic-rich, condensed zone and maximum flooding surface between the top of the transgressive systems tract (TST), Wolfcamp B, and base of the highstand system (HST) tract, Wolfcamp A[74][75][76]. The Wolfcamp C is a lowstand system tract (LST). Creaney and Passey[77] (Figure 15D) appeared to be an excellent depositional model for preserving organic material on the basin floor.

The following difference between Wolfcamp A and B were identified and defined in Figures 15, 16, 17 and Table 1[73].
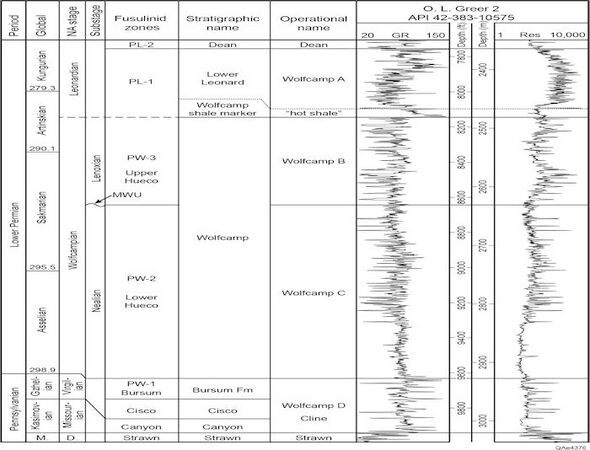
Figure 16 Stratigraphic column Upper Pennsylvanian to Lower Permian from Fu et al.<ref> Fu, Q., R. W. Baumgardner Jr., and H. S. Hamlin, 2020, Early Permian (Wolfcampian) succession in the Permian Basin: Icehouse platform, slope carbonates, and basinal mudrocks, in S. C. Ruppel, ed., Anatomy of a Paleozoic Basin: The Permian Basin, USA: Bureau of Economic Geology Report of Investigations 285 and AAPG Memoir 118, p. 185–225.
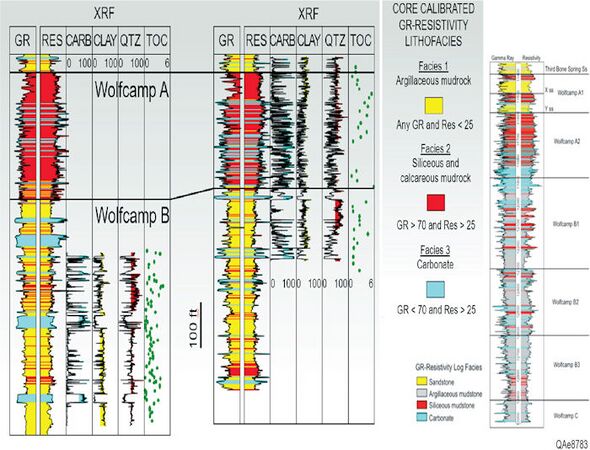
Figure 17 Scott Hamlin’s[73] (reprinted with permission) quick-look open-hole log mineral facies identification for the Wolfcamp confirmed with XRF from whole core. Note the siliceous and calcareous mudrock dominance and higher total TOC in the Wolfcamp A versus argillaceous mudrock and lower TOC in the Wolfcamp B. Also shown are the thicker, amalgamated debrites, carbonate facies in the Wolfcamp B and thin to very thinly bedded turbidite, carbonates facies in the Wolfcamp A. A type log showing the typical oil industry division of the Wolfcamp A and B in the Delaware Basin. The Wolfcamp A1 is present in northern Reeves, Loving, Winkler, and Ward Counties and not present in southern Reeves and Pecos Counties (from Gherabati et al.,[78] reprinted with permission).
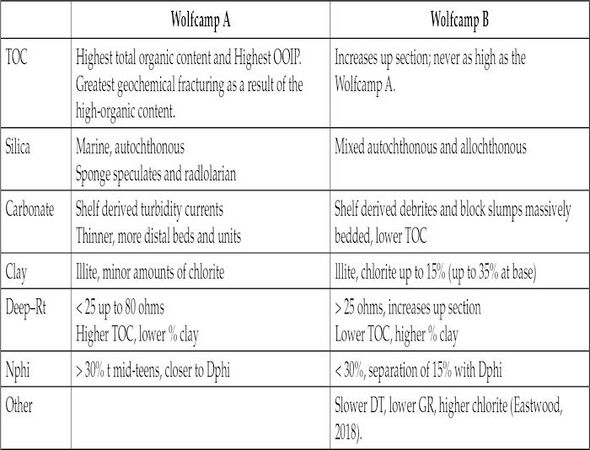
Table 1 Total Organic Carbon, Mineral Facies, Clay, and Open-Hole Log Differences Noted in the Wolfcamp A and B (Fairhurst and Hamlin[73] reprinted with permission).


Drilling vertical wells, running complete log suites, obtaining core, and testing completion techniques in various intervals provided data and information to solve rock property, completion techniques, and productivity of multiple horizons and facies. During that process, Eagle drilled and completed 26 vertical wells and participated in another half dozen outside operated vertical wells before drilling the first horizontal well in the Wolfcamp unconventional reservoirs in the southern Delaware Basin. By 2012, the Midland Basin zonal definitions of the Wolfcamp (Figure 16) were being identified and used by the industry in the Delaware Basin. Completion progression and design of the vertical well program is illustrated in Figure 18. Figure 18A is the chronological progression of the first 17 wells. Conventional reservoirs are shaded yellow, and unconventional resource reservoirs are shaded green. The number and increasingly darker green boxes below each well highlight the number of stages per stratigraphic interval. The diagram illustrates the continued focus down to the now recognized Wolfcamp A and B unconventional resource intervals with a higher number of stages per interval. At the time this chronological progression diagram was created (2011), the Wolfcamp A (upper and lower) was identified as the upper Wolfcamp shale, and Wolfcamp B (upper and lower) was identified as the middle Wolfcamp shale. The Wolfcamp C was recognized as the middle Wolfcamp sandstones (Figure 18A).

The red double arrow lines are conceptual changes in the exploration and development effort. The first change in concept occurs after the third well, Eagle Bell 213-1, included a completion in the upper middle Wolfcamp shale, then one stage in the lower and upper Wolfcamp A and B. That marked the beginning of the focused effort on the Wolfcamp shale. The second break eliminates all other intervals, focusing solely on the Wolfcamp Shale (A and B). The third is the increased number of stages per stratigraphic interval. Eagle, from the start, treated the shales as it had in other unconventional resource plays. Slickwater fracture stimulations versus cross-link gels used more universally throughout the area, pumped completions at higher rates (90–100 barrels per minute vs. 40–50 barrels per minute, which was the standard at the time) and finer mesh proppant (100 mesh vs. 20/40). The idea was to rubblize the rock near wellbore not to create a single or few, long, isolated fractures.
Figure 18B shows the first 26 wells before the first horizontal well with the same horizontal red double arrow lines highlighting changes in concepts and completion efforts. The final division not present in Figure 18A is the geographic concentration in the “sweet spot.” Through the entire process, the first 60-day average production increased at a fairly steady 7 BOPD rate per well throughout the program. Figure 18C is the average of 12 production logs run. These were completed in nine wells, repeating three wells near initial production and again several months later after initial and near-wellbore pressures had declined but still flowing before installing artificial lift. Differences over time were observed. For example, immediately after completion, the Third Bone Spring in transitional pressure did not contribute to production, but after some time and pressure decline in the high-pressure intervals (Wolfcamp A and B), the Third Bone Spring sandstone did contribute. These, together with the fracture identification from imaging logs, especially the interconnected fracture networks versus single plane fracture systems (Figure 14), lead Eagle to change its original horizontal target from the upper Wolfcamp B to the Wolfcamp A.
Figure 18D is the production curve for Reeves County from 1958 through early 2018. Oil production from conventional resource reservoirs peaked in the mid-1960s just below 8000 BOPD. Production decreased continuously until the mid-2000 timeframe with a modest increase during the horizontal drilling for conventional Third Bone Spring sandstones, vertical drilling for Wolfcamp C sandstones, and some Pennsylvanian sandstone production during the 2007–2010 timeframe. Production increased significantly after Eagle Oil & Gas Co.; then others started vertical completions in the Wolfcamp A and B unconventional resource reservoirs. By mid-2011, Reeves County production increased to 10,000 BOPD from just over 2000 BOPD several years earlier. The increase during that timeframe was all from vertical wells. The first horizontal well was drilled by Eagle Oil & Gas Co. in 2011. Shortly after that, the industry switched to horizontal drilling for the unconventional resource reservoirs phasing out vertical programs. Production increased to 100,000 BOPD by the end of 2014 and was just under 500,000 BOPD during 2018.
Diversity of the Unconventional Resource Plays in the Delaware Basin[edit]
Because the industry, in general, was unaware of the Wolfbone play in the Delaware Basin in late 2011, the mantra for Eagle Oil & Gas Co. sales effort of its position, the first Wolfbone sales effort in the industry, was “Delaware’s Wolfberry ... only better.” Not only is the pressure gradient higher in most of the play, but the section is also 2000’ deeper, has higher percentages of liquid to gas production, is a significantly thicker section, and has more potential horizons at most locations. Also there is a great deal more heterogeneity in geology, reservoir characterization parameters, and production results laterally and vertically within the Delaware Basin than the Midland Basin. These result not only in a higher expected value economic outcome per well but also a higher variability of outcomes[31][32][79]. Historically, there are more horizons targeted within the Delaware Basin in both the Wolfcamp and Bone Spring than in the Wolfcamp and Spraberry in the Midland Basin. An additional factor in the Delaware Basin variability is the more complex geologic history of the Delaware Basin than the Midland Basin.
In the northern Delaware Basin, the New Mexico part of the play, the Bone Spring intervals have been the primary horizontal and unconventional resource reservoir targets. On the Northwest Platform, wells were drilled for conventional reservoirs, sandstone, and carbonate in shelf environments. The first more unconventional resource play in the deeper part of the basin was the Avalon ((Figure 2A) along the southern Lee/Eddy County line into Loving County, Texas (Figure 19).

The hydrocarbon productive Avalon is a series of sediment gravity flow fan facies with a northern shelf sediment source and deposited in the deeper parts of the basin. The Avalon facies are carbonate, mixed carbonate–siliciclastic, with the highest quality hydrocarbon reservoirs in carbonate lean, siliciclastic-rich mudstone facies in the more distal parts of the sediment gravity flow fan facies, which have 11%–15% porosity[81][82]. Stratigraphic equivalent fans were derived from shelf carbonates sediment sources surrounding the basin (Central Basin and Diablo Platforms), providing sediment sources for sediment gravity flow fan facies from all directions into the basin. These are more carbonate rich and not the current exploration and development hydrocarbon targets in the basin. The play started in the basinal low, “sweet spot,” a hydrocarbon-saturated siltstone. Because it moved away from the “sweet spot” up into finer grained facies, it became more of an unconventional shale resource play in the siliciclastic mudstone facies. By the end of the first quarter, 2020, 488 horizontal wells had been drilled into and produced from the Avalon, representing 11% of the total Bone Spring unconventional wells (488 of the total 4281). The Avalon also differs from other Bone Spring reservoir targets in that it is a liquid-rich gas play versus most other reservoirs being more oil prone. Other Bone Spring targets now make up the majority targets of the unconventional plays in that formation, with the Second Bone Spring sandstone representing the highest percentage of any individual zone with 40% (1708) of the total Bone Springs wells. These analyses are provided by the Bureau of Economic Geology and TORA Industrial Consortium that divides the Bone Spring targets into seven intervals: Avalon and upper carbonate and lower sandstone intervals for each the First through Third Bone Spring[66] (F. Male, personal communication, 2020).
Through 2017 there was almost a state-by-state preference of the unconventional resource reservoirs in the Delaware Basin: the Bone Spring in New Mexico and Wolfcamp in Texas. Over the past several years, there has been an increasing diversity in targets in both areas as more horizons are being added in each area. Through the first quarter of 2020, 9149 horizontal wells have been drilled and completed in the Delaware Basin, 4% more than in the Midland Basin. The Delaware Basin drilling targets are more evenly divided, with 47% drilling into the Bone Spring and 53% into the Wolfcamp. Forty percent (40%) of the Bone Spring wells are in the Second Bone Spring sandstones, and 23% are in the Third Bone Spring sandstones. Eighty percent (80%) of the Wolfcamp wells (42% of the basin in total) are drilled and completed in the Wolfcamp A; 19% are drilled and completed in the Wolfcamp B; only 1% are drilled into the Wolfcamp C and D. The Wolfcamp A to B ratio is opposite of that in the Midland Basin. The other unconventional resource play that has attracted some attention in the Delaware Basin is the Devonian Woodford Shale. Much like the mid-content, the Woodford is a primary source rock in the West Texas Basin and similar age to the Bakken in the Williston Basin, New Albany in the Illinois Basin, Antrum in the Michigan Basin, and Ohio Shale in the Appalachian Basin[83][84][85][86]. The Devonian system is the source for more than 8% of production and reserves worldwide[87][88], a growing percentage of worldwide reserves with the growth of unconventional plays in the United States, a significant target in Oklahoma, and a potential future economically successful source rock, unconventional resource reservoir play in the West Texas Basin. The past and current Woodford unconventional plays have proven uneconomic.
The West Texas Basin tectonic setting was much different during the Devonian (Figure 20) than the Permian Basin setting (Figure 1). The basin was a passive trailing margin on the southwestern margin of the North American plate after Cambrian rifting and subsidence into the Ordovician. The West Texas, Devonian, or Tobosa Basin[24] shape, size, and deposition (Figure 20) were much like the intracratonic Williston, Illinois, and Michigan Basin developing thick source rock sections during the same time and development of those basins, Ordovician through the Mississippian[10][22]. A difference between those basins and the West Texas Basin was that the West Texas Basin southern margin was open to the ocean to the south, grading into the Marathon facies on the slope and deeper basin farther south. Those gradational boundaries are now buried under the allochthonous Marathon Mountain system thrust over the autochthonous southern West Texas Basin. The Williston Basin may have similarly been open to the west that gradational boundary now buried under the allochthonous Rocky Mountains in Montana. The West Texas Basin Ordovician through the Devonian shelf to deep basin Marathon facies relationship is similar to the Oklahoma and Arkansas foreland shelf to Ouachita thrusts and facies relationships.

The isochore map of the Woodford (Figure 20) shows the almost circular basinal shape (Tobosa Basin) during deposition with the thickest part of the Woodford in southwestern Winkler County and thickening to the south to the open ocean. The Tobosa Basin is consistent with the early 1920s view of the basin before recognition of the Central Basin Platform/Axis during the mid-to-late 1920s.
The Woodford was deposited over a much larger area and is very consistent with the Woodford observed in the mid-continent. The Woodford in the West Texas Basin can be correlated by members and, in some cases, almost bed by bed with the Woodford in the Anadarko Basin (Figure 21).

The major structural features of the West Texas “Permian” Basin are apparent on the top of the Woodford Shale structure map and consistent with most Paleozoic regional mapping surfaces of the basin (Figures 1, 20, 22). Of the almost 600,000 wells drilled in the West Texas Basin, many completion attempts were made in the Woodford because of shows in the source rock when drilling for deeper, conventional reservoirs. Most were uneconomic and quickly abandoned. Multiple more focused attempts were made in 2015–2016 just before Apache announced Alpine High in the southern Delaware Basin[83][85][86].

In the West Texas Basin, the Woodford has proven unsuccessful compared to the Anadarko Woodford for potentially five primary reasons. First, the Woodford in the West Texas Basin is immediately above the Devonian Thirtyone limestone and chert ((Figure 2B). The Thirtyone limestone is a conventional to transitional reservoir primarily productive on the Central Basin Axis into the Midland Basin to the east. It produces from both a deep-water chert and ramp carbonate plays[3]. In areas where these targets are not hydrocarbon productive, they have conventional reservoir porosity and permeability and are water wet. In those areas, when the Woodford has been fracture stimulated, there are no barriers to the fracture treatments building down into the lower pressure Devonian water reservoirs. These wells have temporary oil production quickly followed by water production. The Devonian water, having higher deliverability than oil, quickly dominates production.
Second, of the dozen or so factors typically reviewed for unconventional resource reservoir potential, the West Texas Woodford ranks high in most except for the presence of clay. During the Devonian (Figure 23), the Anadarko Woodford sediment source areas were more distal, and there was less mixing with undiluted biogenic silica being deposited in that basin[89]. The West Texas Basin Woodford was more proximal, and the basin was circumvallated on three sides, being open only to the south to the Marathon/Ouachita slope and deeper water facies. This setting resulted in more mixing and a higher percentage of clay in the Woodford in West Texas. The clay causes three issues for unconventional resource potential. First, these clays are water sensitive. When drilled with water-based muds, the clays commonly swell, causing drilling issues and destroying reservoir quality near the wellbore. Second, the clays away from the wellbore may swell during fracture stimulation resulting in poor performance and formation damage, and third results in less brittle rock.

The third of the five reasons that the Woodford in the West Texas Basin has proven unsuccessful compared to the Anadarko Woodford is thermal maturity. Throughout the Midland Basin, the Woodford is in the thermal oil window and throughout the Delaware Basin is in the gas window. On the Central Basin Axis and Eastern Shelf of the Midland Basin, the Woodford is in the Early Mature stage. The oils are 38 API gravity versus peak maturity oils in the 42+ API gravity range. Whiting Oil drilled, cored the Woodford in 2009, and completed the KCC #503H well in the Keystone South Field in the northern Central Basin Axis to test the Woodford potential[92]. That well encountered more than 500 ft of Woodford with total organic carbon percentages of more than 14% at 8000–9000 ft vertical depth. The well was drilled with an oil-based mud to reduce clay swelling, targeted the upper middle Woodford (similar to the primary target in Oklahoma), and interpreted the clay-rich, lower middle Woodford created a fracture barrier from the Devonian. That well produced at subeconomic rates. Whiting’s interpretation was that the 0.7% Ro was too immature to be economic in the tight unconventional resource reservoir. Whiting also concluded that although natural fracturing seemed sufficient, they were not confident that the stimulated rock volume was adequate.
Finally, Ruppel et al.[93] have recently pointed out two additional considerations for the Woodford as a regional unconventional resource reservoir play. These are that although the Woodford has some high TOC values and is perhaps the most regional of the potential West Texas Basin source rocks, it has limited potential in large regions (north and south) that do not have adequate organic material, and the organic material is not distributed through the entire vertical sequence of the Woodford. Additionally, the organic and inorganic pore structure is minimal and, when present, is of very small pore size, which is why the Woodford has produced gas with limited amounts of oil. “Woodford organic-matter pores in the Permian Basin are generally smaller (tens of nm versus hundreds of nm, respectively [than the Fort Worth Barnett]) and less well developed” (Ruppel et al.,[93] p. 111–112).
Apache completed a series of vertical wells in the Midland Basin in 2013, defined as Wolfwood, Wolfcamp, through Woodford. These are comingled, multistage (typically 12 stages) completions from the Woodford through the Wolfcamp[94] (Figure 24A). Typically, there was only one completion in the Woodford, multiple stages in the Pennsylvanian, with most stages in the Wolfcamp. Early production was determined to be up to 40% from the Woodford, although it represented only 8% of the completed interval. The Woodford quickly depleted, and the majority of subsequent production was from the Wolfcamp. Parsley’s first drilling in the Delaware Basin were vertical wells in the Coyanosa Subbasin (Figure 24B). During 2014, these Wolfbone primary targets also drilled through the Pennsylvanian, Mississippian, into the Woodford and were completed similar to Apache’s Wolfwood wells in the Midland Basin with similar results. The Woodford provided most of the early production but soon dropped off with later production primarily from the Wolfcamp.

Apache was quiet about their Woodford activity in the Delaware Basin until their late 2016 announcement of the Alpine High[95]. The Woodford oil in the Delaware Basin was likely a higher gravity, more mature source rock, unconventional shale resource reservoir with likely higher clay content[89][90][91] than the Wolfcamp, not an optimal unconventional resource reservoir. However, the Woodford in this and other areas of the Delaware Basin likely have lower clay content than the eastern (now Midland Basin) and northern Tobosa Basin Woodford. The Delaware Basin Woodford also has moderately better but not maximum thermal maturity and Productivity Index (PI), with very low porosity and permeability or poor reservoir quality. As observed in the poor-quality Wolfcamp, poor reservoir porosity and permeability may result in an instantaneous gas phase with only limited storage of the more mature hydrocarbon phase[71][72].
The slight change in maturity and oil gravity is significant. Thirty-eight (38) gravity oil documented by Whiting on the Central Basin Axis is twice as viscous as 42 gravity oil at surface conditions and three times more viscous at reservoir conditions, temperature, and depth of 8000’ than 42 gravity oil expected in the Woodford at 11,000’[83][85][86]. A quick-look approach for determining the Woodford potential maturity throughout the West Texas Basin was made using Broadhead[96]</ref> and Bammidi[97] data and information on the Woodford hydrocarbon generation potential in southeastern New Mexico (Figure 25). The PI is measured during the pyrolysis of source samples as PI = S1 / (S1 + S2). S1 is the amount of free hydrocarbons, and S2 is the amount of hydrocarbons generated in the source sample during pyrolysis. The resulting regression[85][86] was multiplied by the top of the Woodford structure map (Figure 22) to obtain the basinwide Expected Woodford Maturity Map (Figure 26). In a tight, unconventional resource reservoir, it would be expected that the early mature PI would be too immature, viscous for optimal productivity as found on the Central Basin Axis and Eastern Shelf of the Midland Basin. The Peak Maturity to Late Maturity having higher API gravity, lower viscosity, higher gas–oil ratios, and, therefore, better depletion drive performance of the Midland Basin and some shallower areas of the Delaware Basin. The best reservoir performance but less liquid and more gas-prone maturities are found in the mid and deeper parts of the Delaware Basin.


This Woodford Maturity Map (Figure 26) provides an adequate quick-look maturation model for the Woodford for the entire basin, but more detailed and specific area information is needed to refine this map and interpretation. For example, the Apache’s Alpine high area is gas condensate. The thermal maturity of that area is likely higher than the general, basinwide model for two reasons. First, the entire basin was uplifted during Cretaceous mountain building in the Rocky Mountains and late Oligocene uplift, which had more pronounced uplift of the western part of the Delaware Basin tilting the entire West Texas Basin to the east[10][17][18][37]. The Alpine High, a continuation of the Diablo Platform, may have been affected more by the uplift, therefore, underestimating the thermal maturity. Second, the Oligocene volcanic events did affect the Diablo Platform (Figures 1, 22, 26) more than the rest of the West Texas Basin, and immediately south of the Alpine High are the Davis Mountains. The volcanic Davis Mountains rise from ± 3000’ elevation of the desert floor to more than 8000’ underlie the Alpine High with dikes and silts reaching into the sedimentary Delaware Basin sediments, especially on the south side of the Alpine High. Both events create a more gas-prone, higher geothermal history and gradient. The uplifted hydrocarbon reservoir results in pressures closer to or above bubble point in the vicinity. The lower reservoir pressure in the tight depletion-drive reservoirs likely leaves more liquid behind in the reservoir than is found in the hydrocarbons produced. Finally, that area has more pre-Mississippian to Permian lines of weakness along the margins of Cambrian rifting and Tobosa Basin that were reactivated during late Mississippian to early Permian (Wolfcampian) tectonic and structural deformation of the developing Permian Basin. That additional faulting results in seal leaks, reservoir compartmentalization, and difficulty staying in zone across fault blocks in horizontal wells needed to make the play economic.
The Mississippian Lime overlies the Woodford. Although an exploited target in the mid-continent (migration pathway or carrier bed unconventional resource play) during the past decade and receiving some exploration attention during the last several decades in the West Texas Basin, the Mississippian Lime has neither been a noteworthy exploration target nor a continuous exploration effort in the basin. The Mississippian Lime isochore does document the transition from the gently subsiding Tobosa Basin to the initial stages of the Marathon/Ouachita orogenic events initiated to the south. The Barnett Shale overlying the Mississippian Lime shows the dramatic development of the Central Basin Axis or Uplift, thickening on the Central Basin Axis’s eastern side in the newly developed Midland Basin. The Barnett reaches a thickness of 200’ and thins gradually into the Midland Basin central and east parts. The Barnett is thickest (600+ ft) in the Delaware Basin into the center of the Tobosa Basin, now developing as the deepest part of the Delaware Basin in Winkler and Loving Counties.
Along the Central Basin Axis western margin, the Delaware Basin eastern margin, are several transtensional, pull-apart basins along that wrench-faulted margin. These features show dramatic thickening from the Barnett into the Pennsylvanian, documenting this major tectonic event timing[83][86].
Regionally, the Barnett shows increased hydrocarbon resistivity and increased shows from top to base. After the Barnett Shale play in the Fort Worth Basin matured early during the 2000–2009 decade, exploration activity followed the Barnett along the Marathon/Ouachita front into the Delaware Basin. Exploration focused on the deep Delaware Basin and southwestern margin of the basin in the area now known as the Alpine High. These efforts proved unsuccessful. More recently, in the latter part of the 2010–2019 decade, a new effort to develop the Barnett as an unconventional resource play has focused on the thicker Barnett in the western Midland Basin, in structural lows on the eastern part of the Central Basin Axis, and the transtensional, pull-apart basins on the west margin of the Central Basin Axis. Although some success has been obtained in individual wells[98], future work and development will prove whether this play can become a regionally economic and significant contributor to the West Texas Basin unconventional resource reserves.
A final play undertaken as an unconventional resource reservoir is the ROZ, Residual Oil Zones, on the Northwest and Central Basin Platforms. These are considered or being represented as unconventional resource plays. Operators are drilling horizontal wells using fracture stimulation completions to connect intermediate to transitional porosity and permeability in these ROZs typically in low-hydrocarbon saturated, conventional reservoirs sometimes combined with tertiary (CO2) recovery with the reservoir above a current oil–water contact (OWC). The horizontal wells increase capital requirements and investment per well and are a hybrid play but are not a geologic unconventional shale resource reservoir.
The residual oil is present because of the basin and individual fields being tilted after oil migration and emplacement in the Leonardian Abo and Clear Fork and Leonardian to Guadalupian San Andres formations. The west to east tilt[10][17][18][37] is because of Late Oligocene to Early Miocene uplift of the Rio Grande Rift system in central New Mexico and followed by Middle–Late Miocene to recent extension. The ROZ and tilted current OWCs were enhanced by the late hydrodynamic flow. The number of wells and recent recovery is minor compared to the unconventional resource potential in the Wolfcamp and Leonardian in the Delaware and Midland basins. For further study and evaluation, the readers are referred to Trentham and Melzer[99].
Wolfcamp and Leonard Production and Reserves[edit]
Current Production and Impact on Total U.S. Production[edit]
It is critical to understand past drilling and production trends to understand the relative significance of current production levels and potential future reserve estimates. Figure 27A illustrates the U.S.[100] Rig Count and Product Price (WTI) from July 1987 to May 2020[11]. For the first 15 years, through April 2003, the rig count remained near a long-term average of 857 active drilling rigs with a long-term average product price for WTI of $21.21. During 2002 WTI pricing started a steady climb, and shortly after that, with oil at $30 per BO, the rig count crossed 1000 rigs in May 2003. The number of rigs rose steadily, peaking above 2000 during late August and early September 2008, two to three months behind the WTI spot price peak of $142 per BO in early July. The rig count peak lagged the 2008 financial stock market drop by about six months. Oil product prices went below $33 per BO during December 2008, and the rig count and financial stock market lows both occurred within a month of each other midyear, 2009. Oil prices rose to $90 per BO at the end of 2010, and by the end of the third quarter, 2011, the rig count was again above 2000. The rig count stayed above 1750 until January 2015 and quickly fell again about six months behind the falling trend in oil prices. Active rigs fell to 404 during May of 2016, about three months behind the lowest oil prices, hitting a 13-year low near $28 per BO in February 2016. Oil rose to more than $60 per BO during January 2018, and the rig rate increased to more than 1000 by April 2018, remaining above 800 through December 2019, falling below 700 by March and below 400 during May 2020 with the oil price collapse associated with the worldwide economic shut-down because of the Covid-19 pandemic.

Figure 27B repeats the rig rate and illustrates the relatively recent change from conventional reservoirs and early vertical unconventional wells to the trend in horizontal drilling mostly for unconventional resource reservoirs. The orange/gold line represents the percentage of vertical wells drilled; the yellow line represents the percentage of horizontal wells drilled. Vertical wells are more typical in conventional reservoirs and early-stage unconventional wells until optimum horizontal targets are defined in the unconventional resource plays. Sometimes that is relatively short, locally occurring over a year or so. The percentage of vertical wells remained above 90% of all wells drilled through June 6, 2003 (Point 1), then fell steadily and abruptly crossing 50% (Point 2) of all wells on March 20, 2009. At that time, product prices had started to rebound off the December 2008 low but the drop in the rig count would not hit its low for three more months. That date and event of the horizontal well drilling percentage becoming greater than vertical well drilling percentage then becomes a marker for converting the U.S Oil and Gas Industry from conventional to unconventional resource concentration. The industry is currently drilling 95%–96% of the wells as horizontals, mostly in unconventional resource reservoirs, and 4%–5% as vertical wells in conventional reservoirs.
Figure 27C adds the well types: gas (red line) and oil (green line) relative percentages. Through the mid-1980s, about 60% of the wells were drilling for oil and 40% for gas. Two controlling factors changed those percentages during the 1990s into the mid-2000s. First, the exploration and development focus changed from the shallower conventional oil reservoirs to deeper conventional gas reservoirs. That occurred because of the change in perceived opportunity remaining in the United States. Second, during the late 1990s into the mid-2000s, unconventional reservoir gas plays were discovered and moved into development. First in the Barnett, then relatively soon after in the Fayetteville shale, Marcellus, and Haynesville–Bossier. At that time, the late 1990s–2009, drilling for gas accounted for more than 80% of all wells being drilled.
As the unconventional gas resource plays were discovered and during early development, it was a conceptual change in thinking for petroleum geologists and engineers to understand methane molecule movement through such tight, low-permeability reservoirs. The thought was that gas migration in the reservoir to wellbore was occurring in the tight unconventional reservoirs but that it would never work in similar reservoirs for longer liquid hydrocarbon chains. It was not until June of 2009 that wells targeting oil jump from 20% of wells to more than 25% during July 2009, 50% of wells by April 2011, and continuing until the percentage reach 76% of wells in November 2012. Since then, the percentage of oil wells has slowly risen to 82% of all wells during March 2020. A relatively rapid switch from gas unconventional resource reservoir plays to oil unconventional resource reservoir plays from mid-2009 to November 2012 with April 2011 as the significant midpoint (crossover).
At the beginning of the twenty-first century, unconventional oil resource reservoirs made up very little national U.S. liquid production. At that time, only Elm Coulee Field in Richland County, Mountain, part of the Williston Basin, was the only producing unconventional oil production outside the West Texas Basin. The Spraberry in the Midland Basin had been productive for years from conventional and transitional unconventional resource reservoirs. Figure 28A shows 100 years of U.S. crude oil production from January 1920 through January 2020. Unconventional resource reservoirs were not recorded separately by the EIA until 2000. The inclusion shows the Spraberry production and minor production from Elm Coulee, Bakken Field, at 5%–10% of U.S. crude oil production through 2010. By the end of 2019, production had increased during the decade from 6 to 13 MMBOPD, with unconventional resource production accounting for more than 60% of total U.S. liquid production during 2019.

The trend in West Texas Basin production followed a similar but even more exaggerated trend (Figure 28B). Conventional and Spraberry production in the West Texas Basin was below 850 MBOPD during 2006 and had risen to just over 900 MBOPD during 2009, increasing to more than 3.7 MMBOPD during 2019 with the contribution of all unconventional resource plays. Unconventional resource reservoir oil production in the West Texas Basin accounted for just under 90% of total liquid production in the basin at the close of the decade.
Total U.S. unconventional reservoir production contributed 1.4 MMBOPD, increasing to 1.9 MMBOPD from January 2007 through 2010 (Figure 29A). The high percentage of West Texas Basin unconventional resources before 2011 was primarily from the Spraberry play in the Midland Basin. The percentage of unconventional production from the West Texas Basin to total U.S. unconventional production dropped from more than 60% to 50% during that time as production first the Bakken then the Eagle Ford developed before the Midland Basin Wolfberry and Delaware Basin Wolfbone plays. Higher acceleration of production increases in the Eagle Ford and Bakken continued through 2014, dropping the West Texas Basin unconventional production percentage to total U.S. unconventional production to 30% by early 2015. During that time, product prices (WTI) were in the $80–110 per BO range, and total U.S. unconventional reservoir production increased to 6 MMBOPD. The oil price drop from 2014 to 2016 resulted in a loss of investment and drilling rigs in all plays but less in the West Texas Basin. The percentage of total unconventional oil rigs in the West Texas Basin rose to 50% of all rigs onshore United States and more than 50% during 2019–2020. West Texas unconventional reservoir production continued to increase as production fell in the other unconventional reservoir plays through late 2017 climbing from 30% to more than 50% of total U.S. unconventional reservoir production at the end of 2019. In late 2017 other U.S. unconventional resource plays production started to rebound with total U.S. unconventional daily production over 9 MMBOPD at the end of 2019.

West Texas Basin unconventional reservoir production peaked in March 2020 at 4.7 MMBOPD and declined to 4.5 MMBOPD during May 2020 (Figure 28B). During that time, the rig count dropped from just over 400 to less than 200. The surprising increases in production, regardless of the rig rate (2007–2019), are attributed to the continuous increase in production per rig (Figure 28C). The change is relatively consistent from January 2007 through the end of the third quarter, 2016, to just over 1000 BO being added to total basin production at the end of that timeframe. A noticeable increase in total basin production per rig from September 2016 through November 2019 is likely because of the increased horizontal drilling lengths per rig and increased proppant and fluid volumes per linear foot that became the industry standards during those time-frames. From September 2016 through July 2017, the rig rate increased from 225 to 375, with a corresponding jump in production per rig of 1516 BOPD per active rig. Total basin production increased from 2.0 to 2.4 MMBOPD during those 10 months. From August 2017 through November 2018, the rig rate increased from 375 to 490, and incremental production per rig increased to 2542 BOPD resulting in total basin unconventional production increasing from 2.4 to 4.6 MMBOPD in just 15 months. From November 2018 through May 2020, the falling rig rate and producers reducing the production of existing wells, total basin production, and increases in production per rig have fallen.
Estimated Future Wolfcamp and Leonard Reserves, Midland, and Delaware Basins[edit]
Multiple models have been developed and used to estimate ultimate recoverable reserves for the Leonard and Wolfcamp unconventional resource reservoirs in the Midland and Delaware basins. Most are simplified volumetric or basic, limited variable input models. The solutions for such systems are integrating many geologic and engineering variables, so the majority of simplified or basic calculations and models typically provide an unsatisfactory sufficient solution for these complicated, heterogeneous unconventional petroleum systems.
The USGS assessment of undiscovered (undrilled) resources for the Wolfcamp (19.9 BBO and 16.0 TCFG) and Spraberry (4.2 BBO and 3.1 TCFG) in the Midland Basin is a total of 24.2 BBO and 19.1 TCFG; 83% of the reserves from the Wolfcamp mostly in the A and B[101][102]. In the Delaware Basin, the USGS has a mean estimate of 46.3 BBO and 281 TCFG; 60% in the Wolfcamp A and B; 25% in the Bone Spring. The 93 BBOE for the Delaware Basin is the largest continuous resource the USGS has assessed[103]. The USGS total estimated mean undrilled unconventional resources for unconventional Wolfcamp and Leonardian for the West Texas (Permian) Super Basin is 70.5 BBO and 300 TCFG. The 120 BBOE estimate is almost twice (191.5%) the 62.67 BBOE produced from the basin through the end of 2019[3][4][5][7]>[8][9].
The USGS methodology is based on generalized geologic and production data and information. It is not as thorough or complete as the detailed work and models developed by the Bureau of Economic Geology’s TORA Industrial Consortium. Tight Oil and Resource Assessment’s research is a continuation of Sloan Foundation and Department of Energy (DOE) studies completed by the TORA team over the past decade that included geologic/reservoir models, economic evaluation, and resource assessment of the Marcellus, Barnett, Haynesville–Bossier, Fayetteville, Eagle Ford, and Bakken, which are evergreen projects for TORA. The focus on the West Texas Basin and models has been continuous work by the TORA Consortium since 2017. The TORA process is geologically based, starting with decades of research on these unconventional resource reservoirs from cores and outcrop studies[54]. Mineralogy assemblages, clay, organic material, porosity measured in the lab from the core are models shared with the petrophysicists measuring and interpreting these variables from open-hole log suites. That work is completed simultaneously with geologists correlating formation and unit tops, structural, stratigraphic, and sedimentological mapping of formation and units throughout the basin tied to geophysical interpretation. These data and interpretations, together with engineering variables, static and dynamic completion, initial measurements, continuous production measurements with operational data, are entered into a Petrel (Schlumberger) three-dimensional (3-D) model. These models include data from thousands of wells in each Midland and Delaware basins. Statistical 3-D modeling of individual variables and production models based on the geologic/reservoir characterization is used to determine original hydrocarbon in place, technically and economically recoverable reserves for the Leonardian through Wolfcamp (upper Pennsylvanian) unconventional resource reservoirs[10].
Tight Oil and Resource Assessment’s work to date in the Midland Basin has focused on the Wolfcamp A and B because those intervals represent 76% of the horizontal unconventional resource reservoir wells drilled and completed by the industry (F. Male, personal communication, 2020). Tight Oil and Resource Assessment’s most recent estimates are 51 BBO, and 94 TCFG are technically recoverable from the Wolfcamp A and B in the Midland Basin, deep basin center[104][105]. Technically recoverable is not the same as the economically recoverable undrilled locations estimated by the USGS. Economically recoverable will be a low percentage of Technically Recoverable at low oil prices and a higher percentage with high oil prices and stable to low drilling, completion, and operating costs. The technically recoverable TORA number is 250% higher than the USGS undiscovered (undrilled) estimate. Tight Oil and Resource Assessment estimates there are approximately 45 BBO and 153 TCFG technically recoverable from the Wolfcamp A and B in the Delaware Basin[80][106][105], approximately twice the USGS estimate for undiscovered (undrilled) estimate in those zones in that basin. Again, similar but not directly comparable figures. The TORA Industrial Consortia work and modeling is a continuing, evergreen project, and TORA will be reporting other horizons technically recoverable reserves in the Wolfcamp–Leonardian unconventional resource reservoirs for both the Midland and Delaware basins soon.
Over the past six months (March–August, 2020), the destruction of product prices, first because of oversupply from international sources and domestic unconventional shale resource play growth, was followed quickly by demand destruction to the Coronavirus pandemic. These provide an important opportunity for individual firms and the oil and gas industry to evaluate, redirect, and rebuild. The oil and gas industry, all industries, and organizations sooner or later experience destruction and need to rebuild. Downsizing is an essential part of growth, and “successful business must be willing to . . . destroy the old while it is successful if they wish to build the new ... If they won’t destroy themselves, others will.”[107] Given this opportunity, what might be some of the potential growth strategies in the West Texas (Permian) Basin over the next decade? The following are suggested:
- It is estimated that 11,500 unconventional resource wells have been drilled in the Wolfcamp A and B, and 18,000 total unconventional resource wells have been drilled and completed in both the Midland and Delaware basins (F. Male, personal communication, 2020). The total in the Wolfcamp A and B is less than 10% of the technically recoverable unconventional resource locations in these intervals, the primary target in both basins[80][104][106]. Given increased well density, cell-block drilling in 2–3 intervals including the Third Bone Spring and Spraberry, 2 mi long laterals with increased stage, cluster, perforation density, increased proppant and fluid levels reached in 2017 to current, there are decades of future drilling and production from these intervals[78][108]. Detailed geologic and engineering data collection, integration, and construction of reservoir characterization 3-D models of the available resource and resource density with completion design and operational changes will require a generation of petroleum geologists and engineers to obtain optimum results for investors. Unknown future optimization will add to the basin productivity and individual investment positive returns. The high capital cost and tight economic parameters of these plays will require firms willing to implement and use the detailed reservoir characterization models and personnel capable of designing, collecting, synthesizing, implementing, and using results to be competitive in these unconventional resource reservoir plays.
- The Wolfcamp A and B are roughly one-third of the Leonard–Wolfcamp intervals’ total thickness in both the Midland and Delaware basins. In defined areas, resource density or opportunity may be as high in other Leonard–Wolfcamp intervals as found regionally in the Wolfcamp A and B. Additionally, lower density resource intervals with more cost-effective extraction or higher product prices will make multiple other zones and intervals in the Leonard–Wolfcamp in these basin attractive targets. Detailed reservoir characterization of these current lower ranked unconventional resource reservoirs must also be completed on basinwide and organizational ring-fenced area concentrations to define the potential of each.
Exploring and developing multiple other resource plays in these basins will continue to be evaluated and targeted by these technically detailed, opportunistic firms. These have already included the Woodford, Barnett, Pennsylvanian unconventional resource reservoirs, and shelf and platform conventional and transitional reservoirs and migration pathway plays.
Secondary and tertiary recovery from traditional reservoirs has not stopped. The trend is toward firms specializing in these technologies and capital focus of the most efficient, long-term recoveries. - Some of these secondary and tertiary recovery methods and new secondary and tertiary recovery in unconventional resource reservoirs are being attempted. Experimentation to define strategies for optimal secondary and tertiary recovery in unconventional resource reservoirs will continue. Improving unconventional resource reservoir recoveries is too attractive given the world-class, world-leading volumes of hydrocarbons in place not to be implemented and significantly improved over the decades ahead. Both the USGS and the Bureau of Economic Geology’s TORA Industrial Consortium estimate that almost twice the volumes from the West Texas Super Basin are expected to be produced from unconventional resource reservoirs than produced during the first 100 years of production from all reservoirs in the basin. Those figures are based only on the primary recovery from unconventional resource reservoirs.
Given that all unconventional resource reservoirs are depletion drive, maintaining original pressures and effective secondary and tertiary recovery will allow future recovery and production figures to be as high as technologic advancement and product price allow. Pressure maintenance in fracture unconventional reservoirs is also crucial in maintaining fracture integrity, keeping the fracture systems open. At depths, more than 8000’ depletion at or below normal hydrostatic pressure may jeopardize natural and artificial fracture system and fracture integrity. As has been stated by Allen Gilmer[109], the West Texas (Permian) Basin unconventional resource should be treated as an endlessly renewable resource. Time, technology development, and innovative firms will access these reserves for decades. - Conventional reservoir plays are being developed, mostly by West Texas (Permian) Basin–focused firms and small, innovative firms that have chosen not to be involved or diverted from the early stages of unconventional resource plays. After a decade of unconventional resource industry focus, new conventional play concepts will develop using source rock, migration, and technologies learned during the decade focused on unconventional resources and reservoirs. A fresh look using both old and new technologies, concepts, and the volumes of new subsurface data and interpretations should generate new conventional reservoir plays.
- Domain experts (geologist, engineers, landman) and managers who understand the technical aspects of exploration, development, drilling, completions, and operations and who are knowledgeable with analytical tools and models will be more successful in designing, developing, and successful implementation of analytical models than data scientists working without the domain experts’ knowledge and expertise[79].
- These half dozen or so suggestions are linear, evident future work and economic opportunity in the West Texas (Permian) Super Basin. Great discoveries come from insight gained from knowledge, immersion in data and information, integration, synthesis, and linear and nonlinear concepts being developed that will become obvious to all once pronounced by a creative petroleum geologist now working or soon to be working in this Super Basin. A good understanding of the basin at a basin scale is still developing; known reserves are greater than what has been produced; technology and science advancement is doubling at ever-increasing rates; local and three-dimensional space are being better, more thoroughly, and continuously defined. These changes and improvements provide the opportunity for value-additive science, engineering, and capital investment, which are unlimited.
Conclusions[edit]
Exploration, discovery, and economic development of hydrocarbons in unconventional resource reservoirs in the West Texas (Permian) Super Basin occurred gradually over decades. Knowledge about the basin and potential of unconventional resources and reservoirs are based on research, published data, and information obtained during a century of fieldwork on the basin margins. In the basin, economic activity including: drilling, subsurface data collection, completions, development, and production first targeting water, then minerals, and finally, hydrocarbons stored in conventional reservoirs contributed to the knowledge of the hydrocarbon potential for unconventional resource reservoirs. Significant exploration discovery events and economic development occurred late in the 2000–2009 decade and during the 2010–2019 decade in these unconventional resource reservoirs. By mid-decade, 2010–2019, investment, development, and hydrocarbon production within the West Texas Super Basin unconventional reservoirs dominated domestic oil and gas industry investment activity, drilling, production, and was the controlling supply-side factor of world oil price. The first and most significant discoveries during initial basin, conventional exploration and early development (1910–1920s) and unconventional exploration and early development (2000–2019), were completed by small, independent groups with large independents and multinational organizations quickly consolidating the optimal assets and future positions to be developed. Many similarities were there to the exploration and discoveries during both periods. Exploration and great economic success are obtained by understanding and integrating multiple sources of technical and business opportunities. These include a thorough understanding of the geology, industry, and academic activity and learnings of others’ testing and results that are significant for the synthesizers who first develop the concepts. Early adopters benefited from implementing successful strategies to realize the opportunities before maturity of potential exploration targets, the full development of each set of possibilities, and saturation from competitors that eventually drive down relative economic success.
The Midland Basin Wolfberry play was developed first in the more porous updip part of the Wolfcamp on the western margin of the Midland Basin immediately east of the sediment source, the eastern margin of the Central Basin Platform. At these localities, shelf carbonates developed on the Central Basin Platform were deposited as coarse-grained, proximal debrites and turbidites that later slumped into the western Midland Basin slope as large fault blocks. These organic-rich, siliceous facies increase away from the basin margin into the basin. These form the intraformational source rock within the Wolfcamp.
The Delaware Basin Wolfbone trend discovery was a continuous investment in discovery, development, and enhanced recovery from the Wolfcamp A and B unconventional reservoirs and abandonment of the geologically successful but subeconomic strategies focused on the Wolfcamp C sandstones, Pennsylvanian sandstones to the east, and good results but technically challenging and high capital cost of the Third Bone Spring horizontal conventional play.
A Wolfcamp Shale (A and B) isochore map was significant in early discovery and development and is still significant to industry activity today in the Delaware Basin. The Wolfcamp A and B Shale was found to be ± 50’ of the 1000’ thickness on the depositional basin floor. Early in the development of the play, it was determined that wells drilled through the Wolfcamp Shale on the now-defined basin floor, actually several miles into the basin floor from the slope to basin-floor contact, was where penetrations put oil in the pits because of the higher pressures of this unconventional resource reservoir, source rock. Wells on the lower slope had oil shows but not the pressure to flow oil into the pits, and wells farther up the slope flared gas.
The Wolfcamp Shale is high pressure because of the maturation and conversion of organic material (kerogen) to hydrocarbons. Those hydrocarbons are trapped in an increasing pressure regime, which is periodically released by fracturing the host rock and is significant in migration into the most proximal conventional reservoir in the Third Bone Spring conventional sandstone reservoirs above. Fractures associated with the organic-rich facies increased upward in the source rock and were near vertical; the fractures were determined to have a geochemical origin. These were formed during the maturation/generation process from kerogen to hydrocarbon. The chemical cracking of organic material during generation expands as hydrocarbon is generated. The expanding hydrocarbon is trapped, creating pressure increases of several thousand pounds fracturing the brittle source rocks.
In the Wolfcamp A, the siliciclastic facies are very similar; the carbonate facies were very different than found in the Wolfcamp B. In the A, the carbonates are dominated by thinly bedded and finer grained turbidite facies with only two debrites at a relatively consistent stratigraphic position in the lower A. These appeared to be much deeper water or distal environments or both than the Wolfcamp B carbonates. They were also more uniformly interbedded with the deep-basin, organic-rich, silica-rich, thinly bedded source rock lithologic facies. The Wolfcamp B carbonates are dominantly thickly bedded, amalgamated debrites. Wolfcamp A and B have higher production rates and reserves in longer laterals with an increased number of stages, more clusters per stage, more perforations per cluster, and higher proppant and fluid rates per linear foot. Slick-water fracture stimulations versus cross-link gels used more universally throughout the area pumped at higher rates (90–100 barrels per minute vs. 40–50 barrels per minute, which was the standard at the time), and finer mesh proppant (100 mesh vs. 20/40) resulted in better completions.
Throughout the West Texas Basin, the Woodford is in the thermal oil window and throughout the Delaware Basin is in the gas window. On the Central Basin Axis and Eastern Shelf of the Midland Basin, the Woodford is in the Early Mature stage. Peak Maturity to Late Maturity having higher API gravity; lower viscosity; higher gas–oil ratios; and, therefore, better depletion drive performance may be found in the deeper Midland Basin and some shallower areas of the Delaware Basin. The best reservoir performance but less liquid and more gas-prone maturities are located in the mid and deeper parts of the Delaware Basin. Other potential resource reservoirs have been suggested.
During the first century (1920–2020) of exploration and production, the West Texas (Permian) Super Basin has produced 63 BBOE. U.S. Geological Society and Bureau of Economic Geology, TORA, estimates are that the discovery of the unconventional resource reservoirs (2000–2019) and future development in the West Texas (Permian) Super Basin could technically produce twice those reserves during the next half-century.
Other works to consult[edit]
- Clemens, G., 1983, Legacy: Mulberry avenue books, 256 p.
- Pioneer Natural Resources, 2013, Independent Petroleum Association of America, Oil, and Gas Investment Symposium, New York, April 16, p. 17.
References[edit]
- ↑ Brown, L. F., Jr., R. F. Solis Iriate, and D. A. Johns, 1987, Regional stratigraphic cross sections, Upper Pennsylvanian and Lower Permian strata (Virgilian and Wolfcampian Series): North-Central Texas: Bureau of Economic Geology, 27 pages and 27 plates.
- ↑ Brown, L. F., Jr., R. F. Solis Iriate, and D. A. Johns, 1990, Regional depositional systems tracts, paleogeography, and sequence stratigraphy, Upper Pennsylvanian and Lower Permian strata: North- and West-Central Texas: Bureau of Economic Geology Report of Investigations 197, 116 p.
- ↑ 3.00 3.01 3.02 3.03 3.04 3.05 3.06 3.07 3.08 3.09 3.10 Dutton, S. P., E. M. Kim, R. F. Broadhead, C. L. Breton, W. D. Raatz, S. C. Ruppel, and C. Kerans, 2005a, Play analysis and digital portfolio of major oil reservoirs in the Permian Basin: Bureau of Economic Geology, Report of Investigations 271, 287 p.
- ↑ 4.0 4.1 4.2 4.3 4.4 Ruppel, S. C., 2019, Anatomy of a Paleozoic Basin: The Permian Basin, USA: Introduction, overview, and evolution, in S. C. Ruppel, ed., Anatomy of a Paleozoic Basin: The Permian Basin, USA: Bureau of Economic Geology, Report of Investigations 285 and AAPG Memoir 118, p. 1–27.
- ↑ 5.0 5.1 5.2 Dutton, S. P., E. M. Kim, R. F. Broadhead, C. L. Breton, W. D. Raatz, S. C. Ruppel, and C. Kerans, 2005b, Play analysis and leading edge oil reservoir development methods in the Permian Basin: Increased recovery through advanced technologies: AAPG Bulletin, v. 89, p. 553–576.
- ↑ Phillips, W. B., 1915, Prefatory note, in, J. A. Udden, Potash in the Texas Permian: Bureau of Economic Geology and Technology, Bulletin of the University of Texas, Austin, Texas, v. 17, 59 p.
- ↑ 7.0 7.1 New Mexico Oil Conservation Division, 2020, accessed May 15, 2020.
- ↑ 8.0 8.1 Popova, O., 2020, Permian Basin, Part 1: Wolfcamp, Bone Spring, Delaware Shale Plays of the Delaware Basin: Geology Review, United States Energy Information Administration (EIA), United States Department of Energy, 35 p.
- ↑ 9.0 9.1 Railroad Commission of Texas, 2020, Oil and gas data sets, accessed February 10, 2021.
- ↑ 10.0 10.1 10.2 10.3 10.4 10.5 10.6 10.7 10.8 10.9 Fairhurst, B., T. E. Ewing, and R. E. Lindsay, 2021, West Texas (Permian), Super Basin, USA: Tectonics, structural development, sedimentation, petroleum systems, and hydrocarbon reserves: AAPG Bulletin, v. 105, no. 6, p. 1099–1147.
- ↑ 11.0 11.1 11.2 11.3 EIA, 2020, Petroleum & other liquids: U.S. Energy Information Administration, accessed June 15, 2020.
- ↑ 12.0 12.1 12.2 12.3 Udden, J. A., 1915, Potash in the Texas Permian, Bureau of Economic Geology and Technology: Bulletin of the University of Texas, 17, 59 p.
- ↑ Van Waterschoot van der Gracht, W. A. J. M., 1929, Barrier reefs in the West Texas Basin: AAPG Bulletin, v. 13, no. 10, p. 1397.
- ↑ Ver Wiebe, W. A., 1929, Tectonic classification of oil fields in the United States: AAPG Bulletin, v. 13, no. 5, p. 409–440.
- ↑ 15.0 15.1 Powers, S., 1927, Buried ridges in West Texas: AAPG Bulletin, v. 11, no. 10, p. 1109–1115.
- ↑ 16.0 16.1 16.2 King, P. B., 1977, The evolution of North America, Revised edition: Princeton University Press, 197 p.
- ↑ 17.0 17.1 17.2 17.3 Ewing, T. E., 2019a, Tectonics of the West Texas (Permian) Basin—Origins, structural geology, subsidence, and later modification, ‘’in’’ S. C. Ruppel, ed., Anatomy of a Paleozoic Basin: The Permian Basin, USA, Volume 1: Bureau of Economic Geology Report of Investigations 285 and AAPG Memoir 118, p. 63–96.
- ↑ 18.0 18.1 18.2 18.3 Ewing, T. E., 2019b, Tectonics and subsidence in the West Texas (Permian) Basin: A model for complex intracratonic basin development: AAPG 2018 Distinguished Lecture Series, 73 p.
- ↑ Sternbach, C. A., 2020, Super Basin thinking: Exploring and revitalizing the world’s greatest petroleum basins: AAPG Bulletin, v. 104, no. 12, p. 2463–2506.
- ↑ Fairhurst, B., 2018b, Resource reservoirs and hydrocarbon source rocks defined by depositional time-intervals and Tectonic Basin type, continental United States, ‘’in’’ B. Fairhurst, ed., Tight Oil Resource Assessment Research Consortium Annual Meeting: Bureau of Economic Geology, March 26, p. 1–14.
- ↑ Walper, J. L., 1977, Paleozoic tectonics of the southern margin of North America: Gulf Coast Association of Geological Societies Transactions, v. 27, p. 230–241.
- ↑ 22.0 22.1 Fairhurst, B., 2016a, Resource reservoirs and hydrocarbon source rocks defined by depositional time-intervals and tectonic basin type, continental United States, Eighth International Symposium on Tight Sandstone and Shale Plays Exploration and Development, State Key Lab of Oil and Gas Reservoir Geology at Chengdu University of Technology, Chinese Petroleum Society, Geological Society of China, July 15–17.
- ↑ 23.0 23.1 23.2 Fairhurst, B., 2018a, Permian Basin reconstruction: Tectonic and stratigraphic relationships Cambrian through Pennsylvanian, ‘’in’’ B. Fairhurst, ed., Tight Oil Resource Assessment Research Consortium Annual Meeting: Bureau of Economic Geology, November 1–2, p. 55–61.
- ↑ 24.0 24.1 24.2 Galley, J. E., 1958, Oil and geology in the Permian Basin of Texas and New Mexico, in L. G. Weeks, ed., Habit of oil: AAPG Symposium, p. 395–446.
- ↑ Soto-Kerans, G. M., D. F. Stocki, X. Janson, T. F. Lawton, and J. A. Covault, 2020, Orogen proximal sedimentation in the Permian foreland basin: Geosphere, v. 16, no. 2 p. 567–593.
- ↑ Jarvie, D. M, 2012a, Shale resource systems for oil and gas: Part 1—Shale-gas resource systems, ‘’in’’ J. A. Breyer, ed., Shale reservoirs—Giant resources for the 21st century: AAPG Memoir 97, p. 69–87.
- ↑ Jarvie, D. M., 2012b, Shale resource systems for oil and gas: Part 2—Shale-oil resource systems, ‘’in’’ J. A. Breyer, ed., Shale reservoirs—Giant resources for the 21st century: AAPG Memoir 97, p. 89–119.
- ↑ Liang, C., Y. Cao, Z. Jiang, J. Wu, S. Guoqi, and Y. Wang, 2017, Shale oil potential of lacustrine black shale in Eocene Dongying depression: Implications for geochemistry and reservoir characteristics: AAPG Bulletin, v. 101, no. 11, p. 1838–1858.
- ↑ Hough, G. A., and J. A. Breyer, 2019, Carrier beds as unconventional reservoirs: New Directions in Geosciences for Unconventional Resources, Banff, Canada, October 15–17, 5 p.
- ↑ 30.0 30.1 Meissner, F. F., 1978, Petroleum geology of the Bakken Formation, Williston Basin, North Dakota and Montana: Williston Basin Symposium, The Montana Geological Society, 24th Annual Conference, Billings, Montana, p. 159–179.
- ↑ 31.0 31.1 Fairhurst, B., 2019, The perfect unconventional resource portfolio: Houston Geological Society Bulletin, v. 62, no. 2, p. 35–43.
- ↑ 32.0 32.1 Fairhurst, B., 2020b, The perfect unconventional resource portfolio: Unconventional Resources Technology Conference paper 2940, 9 p.
- ↑ Phillips, W. B., 1901, Texas Petroleum: University of Texas Mineral Survey Bulletin, 1, 101 p.
- ↑ Phillips, W. B., 1902, Sulphur, oil and quicksilver in Trans-Pecos: University of Texas Mineral Survey Bulletin, 2, p. 27–42.
- ↑ Richardson, G. A., 1904, Reconnaissance in Trans-Pecos Texas: North of the Texas and Pacific Railway: Bulletin of the University of Texas, Austin, Texas, v. 23, 119 p.
- ↑ 36.0 36.1 Udden, J. A., 1917, Notes on the geology of the glass mountains: University of Texas Bulletin, 1753, p. 1–59.
- ↑ 37.0 37.1 37.2 37.3 Udden, J. A., C. L. Baker, and E. Bose, 1916, Review of the Geology of Texas, Bureau of Economic Geology and Technology: Bulletin of the University of Texas, 44, 164 p., 1 plate.
- ↑ Bose, E., 1917, The Permo-carboniferous ammonoids of the glass mountains: West Texas, and their stratigraphical significance: University of Texas Bulletin, no. 1762, 241 p.
- ↑ 39.0 39.1 Beede, J. W., 1918a, Further notes on the structure near Robert Lee, Coke County, Texas: University of Texas Bulletin, no. 1847, p. 3–7, 1 plate.
- ↑ Beede, J. W., 1918b, Notes on the geology and oil possibilities of the Northern Diablo Plateau in Texas: University of Texas Bulletin, 1852, 44 p.
- ↑ 41.0 41.1 Liddle, R. A., 1918, The Marathon Fold and its influence on petroleum accumulation: University of Texas Bulletin, no. 1847, p. 9–16, 1 plates.
- ↑ 42.0 42.1 Liddle, R.A., and T. M. Prettyman, 1918, Geology and mineral resources of Crockett County with notes on the stratigraphy, structure, and oil prospects of the Central Pecos Valley: University of Texas Bulletin, no. 1857, 97 p., 4 plates.
- ↑ Pratt, W. E., 1921, The present excitement at Fort Stockton, Texas: AAPG Bulletin, v. 5, no. 1, p. 88–89.
- ↑ King, P. B., 1942, Permian of west Texas and southeastern New Mexico, parts 1 and 2: AAPG Bulletin, v. 26, p. 535–763.
- ↑ King, P. B., 1948, Geology of the southern Guadalupe Mountains, Texas: United States Geological Survey Professional Paper 215.
- ↑ Ross, C. A., 1963, Standard Wolfcampian Series (Permian), Glass Mountains, Texas: Geological Society of America Memoir 88, 205 p.
- ↑ 47.0 47.1 Fairhurst, B., and B. Lindsay, 2020, History of geologic concepts that opened exploration and development of the West Texas (Permian) Basin 1915–1925: West Texas Geological Society Annual Meeting, September 23.
- ↑ 48.0 48.1 48.2 48.3 Lindsay, R. F., 2018, Significance of the O.C. Harper Red Bed Map and its influence on the growth of the gulf oil company: Presented at the Permian Basin Petroleum Museum, June 19, 63 p.
- ↑ Oriel, S. S., D. A. Myers, and E. J. Crosby, 1967, West Texas Permian Basin Region, ‘’in’’ E. D. McKee, S. S. Oriel, et al., eds., Paleotectonic investigations of the Permian System in the United States: Geological Survey Professional Paper 515, p. 21–60.
- ↑ West Texas Geological Society, 1942, Resume of geology of south Permian basin, Texas and New Mexico: Geological Society of America Bulletin, v. 53, p. 539–560.
- ↑ Lindsay, R. F., P. Mann, and C. Sternbach, 2020, Conventional and unconventional exploration of the Permian Basin: West Texas Field Trip, Lindsay Consulting, 122 p.
- ↑ 52.0 52.1 Handford, C. R., 1981, Sedimentology and genetic stratigraphy of Dean and Spraberry formations (Permian), Midland Basin, Texas: AAPG Bulletin, v. 65, p. 1602–1616.
- ↑ Smith, J. C., 2010, Spraberry-Dean Sandstone Fields: Texas State Historical Association.
- ↑ 54.0 54.1 Hamlin, H. S., and R. W. Baumgardner, 2012, Wolfberry (Wolfcampian-Leonardian) deep-water depositional systems in the Midland Basin: Stratigraphy, lithofacies, reservoirs, and source rocks: Bureau of Economic Geology, Report of Investigations 277, 61 p., 4 plates.
- ↑ Vest, E. L., Jr., 1970, Oil fields of Pennsylvanian-Permian Horseshoe Atoll, West Texas, ‘’in’’ M. T. Halbouty, ed., Geology of giant petroleum fields: AAPG Memoir 14, p. 185–203.
- ↑ 56.0 56.1 Montgomery, S. L., D. S. Schechter, and J. Lorenz, 2000, Advanced reservoir characterization to evaluate carbon dioxide flooding, Spraberry Trend, Midland Basin, Texas: AAPG Bulletin, v. 84, no. 9, p. 1247–1273.
- ↑ Olien, R. M., and D. D. Hinton, 2007, Wildcatters: Texas independent oilmen: Texas, A & M Press, 234 p.
- ↑ Boer, F. P., 2010, Opportunity: The hidden side of wealth: Xlibris, Bloomington, Indiana, 359 p.
- ↑ Reuters, 2011, Chronology: Big Oil’s years of merger mania: Reuters Business News, July 14, 2 p.
- ↑ Hollandsworth, S., 2010, That’s Oil, Folks!: Texas Monthly, accessed April 20, 2020.
- ↑ 61.0 61.1 61.2 61.3 61.4 Henry, J., 2012, “Wolfberry”—Wolfcamp/Spraberry: How It Started: AAPG Search and Discovery Article #110164, 14 p.
- ↑ 62.0 62.1 Paul, C., 2014, Oil legend Jim Henry and the Fathers of the Wolfberry: Oil show honoree on the innovation that built the boom: Odessa American, July 27.
- ↑ 63.0 63.1 Sternbach, C., and W. DeMis, 2017, Permian Basin energy capital of innovation: Yesterday, Today, Tomorrow!: AAPG Search and Discovery Article #90293, 2 p.
- ↑ Montgomery, S. L, 1996, Permian “Wolfcamp” limestone reservoirs: Powell Ranch Field, Eastern Midland Basin: AAPG Bulletin, v. 80, no. 9, p. 1349–1365.
- ↑ Mazzullo, S. J., 1997, Permian “Wolfcamp” Limestone reservoirs: Powell Ranch Field, Eastern Midland Basin: AAPG Bulletin, v. 81, no. 10, p. 1750–1753.
- ↑ 66.0 66.1 Carr, D. L., 2019, Stratigraphic architecture and facies of the Bone Spring Formation (Permian), Delaware Basin, New Mexico and Texas, in W. Fairhurst, ed., Tight Oil Resource Assessment Research Consortium (TORA) Annual Meeting, May 8–9, 2019, p. 1–10.
- ↑ Masterson, R., 2010, North-South geologic cross section of the 3rd bone spring sandstones: Reeves and Ward Counties, Eagle Oil & Gas, 1 plate.
- ↑ 68.0 68.1 68.2 Hanson, M. L., 2010, Structure Map on top of the Wolfcamp shale, Isopach Map of the Wolfcamp shale (Wolfcamp A&B), and Isopach Map of the Sheldon carbonate: Eagle Oil & Gas Geologic Maps, 3 plates.
- ↑ Eastwood, R., 2018, Delaware Basin Petrophysics: Bone Spring/Wolfcamp, in W. Fairhurst, ed., Tight Oil Resource Assessment (TORA) Annual Meeting: Bureau of Economic Geology, March 26, p. 111–120.
- ↑ Gherabati, A., 2019, Fluid properties in the Delaware Basin, ‘’in’’ W. Fairhurst, ed., Tight Oil Resource Assessment Research (TORA) Consortium Annual Meeting: Bureau of Economic Geology, May 8–9, p. 53–58.
- ↑ 71.0 71.1 Pepper, A., A. Deobbert, J. M. Laigle, and L. Laigle, 2020a, Greater Permian Basin petroleum systems—what are we learning in the transition from conventional to unconventional: Houston Geological Society Bulletin, v. 62, no. 9, p. 9–11.
- ↑ 72.0 72.1 Pepper, A. S., E. Rhoden, P. Foy, H. Ross, J. M. Laigle, and C. Yarbrough, 2020b, Petroleum systems modeling of Wolfcamp Formation reservoir fluid saturations and compositions in the Delaware Basin: Key principles and workflows: West Texas Geological Society Annual Fall Symposium, September 23, 2020.
- ↑ 73.0 73.1 73.2 73.3 Fairhurst, B., and S. Hamlin, 2018, Stratigraphic observations of the upper Wolfcampian shale (A&B), Southern Delaware Basin, West Texas: Variations in stratigraphy, depositional processes, mineral facies and log measurements, in W. Fairhurst, ed., Tight Oil Resource Assessment (TORA) Annual Meeting: Bureau of Economic Geology, March 26, p. 91–110.
- ↑ Vail, P. R., 1987, Seismic stratigraphy interpretation using sequence stratigraphy, ‘’in’’ A. W. Bally, ed., Atlas of Seismic Stratigraphy: AAPG Studies in Geology 27, v. 1, p. 1–10.
- ↑ 75.0 75.1 Fairhurst, B., M. L. Hanson, F. Reed, and N. Pieracacos, 2012, Wolfbone play evolution southern Delaware Basin: Geologic concept modifications that have enhanced economic success: AAPG Search and Discovery Article #10412, 74 p.
- ↑ 76.0 76.1 Fairhurst, B., and M. L. Hanson, 2013, Wolfbone oil-saturated, super sweet spot, southern Delaware Basin: Integrated approach from exploration to geologic/reservoir modeling and field development: Unconventional Resources Technology Conference paper 158185, 10 p.
- ↑ 77.0 77.1 Creaney, S., and Q. R. Passey, 1993, Recurring patterns of total organic carbon and source rock quality within a sequence stratigraphic framework: AAPG Bulletin, v. 77, p. 386– 401.
- ↑ 78.0 78.1 Gherabati, A., K. Smye, G. McDaid, and S. Hamlin, 2019, Developing a depletion score to study well spacing and the parent–child effect, in E. Goodman, ed., Tight Oil Resource Assessment Research Consortium Annual Meeting: Bureau of Economic Geology, November 20–21, p. 37–44.
- ↑ 79.0 79.1 Fairhurst, B., 2020a, Analytics, machine learning, and AI for Independent Petroleum Geologists and Independent Oil and Gas Companies; successful case study, Rodessa Oil Pool, Martinville Field, Simpson County, Mississippi: Gulf Coast Association of Geological Societies Journal, v. 9, p. 93–114.
- ↑ 80.0 80.1 80.2 Yang, Q., S. Ikonnikova, A. Gherabati, E. D. Goodman, and G. McDaid, 2019, Delaware Basin Wolfcamp: A productivity analysis and technically recoverable resources projection, in E. D. Goodman, ed., Tight Oil Resource Assessment Research Consortium Annual Meeting, November 20–21, p. 58–67.
- ↑ Stolz, D. J., 2014, Reservoir Character of the Avalon Shale (Bone Spring Formation) of the Delaware Basin, West Texas and Southeast New Mexico: Effect of Carbonate-rich Sediment Gravity Flows, M.S. thesis, University of Kansas, Lawrence, Kansas, 155 p.
- ↑ Stolz, D. J., E. K. Franseen, and R. H. Golstein, 2015, Character of the Avalon Shale (Bone Spring Formation) of the Delaware Basin, West Texas and Southeast New Mexico: Effect of Carbonate-Rich Sediment Gravity Flows: Unconventional Resources Technology Conference, July 20–22, 2015, 7 p.
- ↑ 83.0 83.1 83.2 83.3 83.4 83.5 83.6 Fairhurst, B., 2016b, Woodford Exploration Seminar Course Materials, 230 p.
- ↑ Roen, J. B., 1984, Geology of the Devonian black shales of the Appalachian Basin: Organic Geochemistry, v. 5, no. 4, p. 241–254.
- ↑ 85.0 85.1 85.2 85.3 85.4 85.5 Fairhurst, B., 2015a, “Stealth” exploration and serendipitous exploration for the Texas Woodford, Woodford Shale forum: Focus on optimization: AAPG Geosciences Technology Workshop, May 12.
- ↑ 86.0 86.1 86.2 86.3 86.4 86.5 86.6 Fairhurst, B., 2015b, “Stealth” and serendipitous exploration for the Texas Woodford, 26th Annual West Texas Geological Society Fall Symposium, October 7–9.
- ↑ Grunau, H. R., 1983, Abundance of source rocks for oil and gas worldwide: Journal of Petroleum Geology, v. 6, no. 1, p. 39–54.
- ↑ Klemme, H. D., and G. F. Ulmishek, 1991, Effective petroleum source rocks of the world: Stratigraphic distribution and controlling depositional factors: AAPG Bulletin, v. 75, no. 12, p. 1809–1851.
- ↑ 89.0 89.1 89.2 Comer, J. B., 2005, Facies distribution and hydrocarbon production potential of Woodford Shale in the southern midcontinent, in B. J. Cardott, ed., Unconventional energy resources in the Southern Midcontinent, 2004 Symposium: Norman, Oklahoma, Oklahoma Geological Survey, Circular 110, p. 51–62.
- ↑ 90.0 90.1 Comer, J. B., 1991, Stratigraphic analysis of the Upper Devonian Woodford Formation, Permian Basin, West Texas and Southeastern New Mexico: Bureau of Economic Geology Report of Investigations 201, 63 p.
- ↑ 91.0 91.1 Comer, J. B., 2008, Woodford Shale in southern midcontinent, USA-transgressive system tract marine source rocks on an arid passive continental margin with persistent oceanic upwelling: AAPG Search and Discovery article #90078.
- ↑ Parker, A., D. Entzminger, J. Keone, M. Sonnenfeld, and L. Canter, 2014, Lessons Learned from the KCC #503H Woodford Horizontal Well at Keystone South Field, Winkler County, Texas: AAPG Search and Discovery Article #90190, 18 p.
- ↑ 93.0 93.1 Ruppel, S. C., H. Rowe, R. M. Reed, J. E. Barrick, E. W. James, and R. G. Loucks, 2020, The Woodford Formation of the Permian Basin: Regional, middle to late Devonian transgression of the southern midcontinent and accompanying global anoxia, in S. C. Ruppel, ed., Anatomy of a Paleozoic Basin, the Permian Basin, USA: Bureau of Economic Geology, Report of Investigations 285 and AAPG Memoir 118, p. 75–124.
- ↑ 94.0 94.1 Farris, G. S., J. J. Christmann, I V, T. E. Voytovich, and F. B. Parish, 2014, Apache Investor Day Presentation, Houston, 172 p.
- ↑ Christmann, J., 2016, Apache Presentation: Barclays CEO Energy-Power Conference, September 7, 2016, New York City, 49 p.,
- ↑ 96.0 96.1 Broadhead, R. F., 2010, The Woodford Shale in southeastern New Mexico: Distribution and source rock characteristics: New Mexico Geology, v. 32, no. 3, p. 79–90.
- ↑ Bammidi, V. S., 2011, Resource potential of the Woodford Shale in New Mexico, Southwest section: AAPG Southwest section meeting publication of abstracts, etc., 58 p.
- ↑ Party, J. M., 2020, Permian Basin: Barnett Shale Play emerges: AAPG Global Super Basins Leadership Conference.
- ↑ Trentham, B., and S. Melzer, 2010, Residual oil zones: From science to commercial exploitation: AAPG Rocky Mountain Section meeting June 13–16.
- ↑ Hughes, B., 2020, North American Rig Count: Baker Hughes.
- ↑ Gaswirth, S. B., K. R. Marra, P. G. Lillis, T. J. Mercier, H. M. Leathers-Miller, C. J. Schenk, R. R. Klett, et al., 2016, Assessment of undiscovered continuous oil resources in the Wolfcamp shale of the Midland Basin, Permian, Basin Province, Texas: United States Geological Survey Fact Sheet 2016–3092, 4 p.
- ↑ Marra, K. R., S. B. Gaswirth, C. J. Schenk, H. M. Leathers-Miller, T. R. Klett, T. J. Mercier, P. A. Le, et al., 2017, Assessment of undiscovered oil and gas resources in the Spraberry Formation of the Midland Basin, Permian Basin Province, Texas, U.S. Geological Survey Fact Sheet 2017–3029, 2 p.
- ↑ Gaswirth, S. B., K. L. French, J. K. Pitman, K. R. Marra, T. J. Mercier, H. M. Leathers-Miller, C. J. Schenk, et al., 2018, Assessment of undiscovered continuous oil and gas resources in the Wolfcamp Shale and Bone Spring Formation of the Delaware Basin, Permian Basin Province, New Mexico and Texas, United States Geological Survey Fact Sheet 2018–3073, 4 p.
- ↑ 104.0 104.1 Ikonnikova, S., E. Vankov, S. Hamlin, M. Pyrzs, F. Male, R. Dommisse, and G. McDaid, 2018a, Statistical analysis of individual well productivity: Case study of Midland Wolfcamp B (and A) wells, in W. Fairhurst, ed., Tight Oil and Resources Assessment (TORA) Annual Meeting: Bureau of Economic Geology, March 26, p. 21–28.
- ↑ 105.0 105.1 Casey, B., 2020, Visualization and Discussion of Recent Southern Midland Basin Geologic Modeling: Tight Oil Resource Assessment Spring Meeting, May 28–29.
- ↑ 106.0 106.1 Ikonnikova, S., Q. Yang, S. Hamlin, V. Del Carpio Neyra, G. Gulen, and B. Fairhurst, 2018b, Individual well productivity and profitability of Midland Wolfcamp A and B wells, in W. Fairhurst, ed., Tight Oil Resource Assessment Research Consortium (TORA) Annual Meeting: Bureau of Economic Geology, November 1–2, p. 89–96.
- ↑ Thurow, L. C., 1999, Building wealth: the new rules for individuals, companies, and nations in a knowledge-based economy: New York, HarperCollins, 313 p.
- ↑ Gherabati, A., G. McDaid, R. Dommisse, and R. Sabbagh, 2018, Well spacing and undrilled (future) well inventory in Midland Basin, in W. Fairhurst, ed., Tight Oil Resource Assessment Research Consortium Annual Meeting: Bureau of Economic Geology, November 1–2, p. 75–78.
- ↑ Blackmon, D., 2017, Gilmer: We should view the Permian Basin as a permeant resource: Forbes.