Difference between revisions of "Measuring displacement pressure using mercury injection"
Cwhitehurst (talk | contribs) |
Cwhitehurst (talk | contribs) m (added Category:Treatise Handbook 3 using HotCat) |
||
| (14 intermediate revisions by 3 users not shown) | |||
| Line 6: | Line 6: | ||
| part = Predicting the occurrence of oil and gas traps | | part = Predicting the occurrence of oil and gas traps | ||
| chapter = Evaluating top and fault seal | | chapter = Evaluating top and fault seal | ||
| − | | frompg = 10- | + | | frompg = 10-70 |
| − | | topg = 10- | + | | topg = 10-71 |
| author = Grant M. Skerlec | | author = Grant M. Skerlec | ||
| link = http://archives.datapages.com/data/specpubs/beaumont/ch10/ch10.htm | | link = http://archives.datapages.com/data/specpubs/beaumont/ch10/ch10.htm | ||
| Line 14: | Line 14: | ||
| isbn = 0-89181-602-X | | isbn = 0-89181-602-X | ||
}} | }} | ||
| − | The displacement pressure (P<sub>d</sub>) is routinely inferred by forcing mercury into the pore space of a sample (cores or cuttings) and measuring the percent of mercury saturation vs. increasing pressure. | + | The [[displacement pressure]] (P<sub>d</sub>) is routinely inferred by forcing mercury into the pore space of a sample ([[Core description|cores]] or [[Mudlogging: drill cuttings analysis|cuttings]]) and measuring the percent of mercury saturation vs. increasing pressure. |
==Procedure== | ==Procedure== | ||
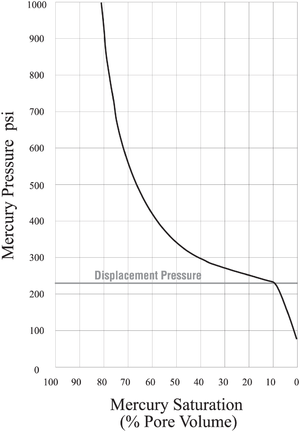
| − | [[file:evaluating-top-and-fault-seal_fig10-48.png|300px|thumb|{{figure number|1}} | + | [[file:evaluating-top-and-fault-seal_fig10-48.png|300px|thumb|{{figure number|1}}Typical mercury capillary curve for a sandstone.<ref name=ch10r67>Schowalter, T. T., 1979, [http://archives.datapages.com/data/bulletns/1977-79/data/pg/0063/0005/0700/0723.htm Mechanics of secondary hydrocarbon migration and entrapment]: AAPG Bulletin, vol. 63, no. 5, p. 723–760.</ref>]] |
| − | [[:file:evaluating-top-and-fault-seal_fig10-48.png|Figure 1]] shows a typical mercury capillary curve for a sandstone. Mercury is first forced into the largest connected pore throats. Saturation increases with increasing pressure as mercury continues to be forced into progressively smaller pore throats. | + | [[:file:evaluating-top-and-fault-seal_fig10-48.png|Figure 1]] shows a typical mercury capillary curve for a sandstone. Mercury is first forced into the largest connected [[Pore throat size and connectivity|pore throats]]. Saturation increases with increasing pressure as mercury continues to be forced into progressively smaller pore throats. |
==Values of displacement pressure>== | ==Values of displacement pressure>== | ||
| + | |||
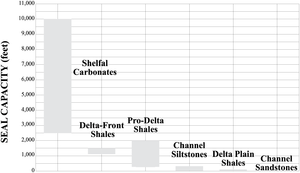
| + | [[file:evaluating-top-and-fault-seal_fig10-49.png|300px|thumb|{{figure number|2}}Chart showing range of seal capacities for the different facies. Data from Vavra et al.<ref name=ch10r87 />]] | ||
| + | |||
Displacement pressure (P<sub>d</sub>) is defined as the pressure necessary to form a continuous hydrocarbon filament in the pore space of the seal. It is commonly inferred from the injection pressure at 10% saturation<ref name=ch10r67 /> for two reasons: | Displacement pressure (P<sub>d</sub>) is defined as the pressure necessary to form a continuous hydrocarbon filament in the pore space of the seal. It is commonly inferred from the injection pressure at 10% saturation<ref name=ch10r67 /> for two reasons: | ||
| Line 28: | Line 31: | ||
* Measured saturations required to create a continuous hydrocarbon filament range from 5–17% with an average of 10%.<ref name=ch10r67 /> | * Measured saturations required to create a continuous hydrocarbon filament range from 5–17% with an average of 10%.<ref name=ch10r67 /> | ||
| − | Alternatively, some workers define P<sub>d</sub> as the pressure at the first inflection point of capillary curve.<ref name=ch10r42>Katz, A. | + | Alternatively, some workers define P<sub>d</sub> as the pressure at the first inflection point of capillary curve.<ref name=ch10r42>Katz, A. J., and A. H. Thompson, 1986, Quantitative prediction of permeability in porous rock: Physical Review Bulletin, vol. 34, p. 8179–8181., 10., 1103/PhysRevB., 34., 8179</ref> [[:file:evaluating-top-and-fault-seal_fig10-49.png|Figure 2]] shows the inferred P<sub>d</sub> at both 10% saturation and at the inflection point. |
==Cores, cuttings, and low-permeability rocks== | ==Cores, cuttings, and low-permeability rocks== | ||
| − | Samples for mercury injection laboratory analysis can include cores as well as cuttings. Measurements made from cuttings do not yield the same value as those from cores, so they require an empirical correction factor that ranges from 15–250 psi.<ref name=ch10r78>Sneider, R. | + | Samples for mercury injection laboratory analysis can include cores as well as cuttings. Measurements made from cuttings do not yield the same value as those from cores, so they require an empirical correction factor that ranges from 15–250 psi.<ref name=ch10r78>Sneider, R. M., and G. Bolger, 1993, Estimating seals from wireline logs of clastic seals and reservoir intervals, in J. Ebanks, J. Kaldi, and C. Vavra, eds., Seals and Traps: A Multidisciplinary Approach: AAPG Hedberg Research conference, unpublished abstract.</ref> |
| − | Seals with low permeability and small pore throats may require longer equilibration times during mercury injection.<ref name=ch10r87>Vavra, C. | + | Seals with low [[permeability]] and small pore throats may require longer equilibration times during mercury injection.<ref name=ch10r87>Vavra, C. L., J. G. Kaldi, and R. M. Sneider, 1992, [http://archives.datapages.com/data/bulletns/1992-93/data/pg/0076/0006/0000/0840.htm Geological applications of capillary pressure: a review]: AAPG Bulletin, vol. 76, no. 6, p. 840–850.</ref> |
==Converting laboratory measurements== | ==Converting laboratory measurements== | ||
| Line 40: | Line 43: | ||
:<math>\mbox{P}_{\rm dh} = \frac{\gamma_{\rm h}\cos \theta_{\rm h}\mbox{P}_{\rm dm}}{\gamma_{\rm m} \cos \theta_{\rm m}}</math> | :<math>\mbox{P}_{\rm dh} = \frac{\gamma_{\rm h}\cos \theta_{\rm h}\mbox{P}_{\rm dm}}{\gamma_{\rm m} \cos \theta_{\rm m}}</math> | ||
| − | Displacement pressures measured in the air-mercury system are then converted to the hydrocarbon–water system at subsurface conditions. To convert, we must know the temperature, pressure, [[wettability]], and coefficient of interfacial tension for the hydrocarbon phase. These parameters are commonly inferred from the composition, gas–oil ratio, and API gravity.<ref name=ch10r67 /><ref name=ch10r87 /> For the air–mercury system, the wettability of mercury is 140° (cos 140 = 0.766). The coefficient of interfacial tension for mercury is 485 dynes/cm.<ref name=ch10r87 /> | + | where: |
| + | |||
| + | * γ = interfacial tension, dynes/cm | ||
| + | * θ = contact angle or [[wettability]], degrees | ||
| + | |||
| + | Displacement pressures measured in the air-mercury system are then converted to the hydrocarbon–water system at subsurface conditions. To convert, we must know the temperature, pressure, [[wettability]], and coefficient of interfacial tension for the hydrocarbon phase. These parameters are commonly inferred from the composition, [http://www.enggcyclopedia.com/2012/03/gas-oil-ratio-gor/ gas–oil ratio], and [[API gravity]].<ref name=ch10r67 /> <ref name=ch10r87 /> For the air–mercury system, the wettability of mercury is 140° (cos 140 = 0.766). The coefficient of interfacial tension for mercury is 485 dynes/cm.<ref name=ch10r87 /> | ||
==See also== | ==See also== | ||
| Line 56: | Line 64: | ||
[[Category:Predicting the occurrence of oil and gas traps]] | [[Category:Predicting the occurrence of oil and gas traps]] | ||
[[Category:Evaluating top and fault seal]] | [[Category:Evaluating top and fault seal]] | ||
| + | [[Category:Treatise Handbook 3]] | ||
Latest revision as of 19:46, 31 March 2022
| Exploring for Oil and Gas Traps | |

| |
| Series | Treatise in Petroleum Geology |
|---|---|
| Part | Predicting the occurrence of oil and gas traps |
| Chapter | Evaluating top and fault seal |
| Author | Grant M. Skerlec |
| Link | Web page |
| Store | AAPG Store |
The displacement pressure (Pd) is routinely inferred by forcing mercury into the pore space of a sample (cores or cuttings) and measuring the percent of mercury saturation vs. increasing pressure.
Procedure

Figure 1 shows a typical mercury capillary curve for a sandstone. Mercury is first forced into the largest connected pore throats. Saturation increases with increasing pressure as mercury continues to be forced into progressively smaller pore throats.
Values of displacement pressure>

Displacement pressure (Pd) is defined as the pressure necessary to form a continuous hydrocarbon filament in the pore space of the seal. It is commonly inferred from the injection pressure at 10% saturation[1] for two reasons:
- Most reservoirs have a pronounced plateau along which saturation rapidly increases. The pressure at 10% or 40% saturation gives a similar Pd.
- Measured saturations required to create a continuous hydrocarbon filament range from 5–17% with an average of 10%.[1]
Alternatively, some workers define Pd as the pressure at the first inflection point of capillary curve.[3] Figure 2 shows the inferred Pd at both 10% saturation and at the inflection point.
Cores, cuttings, and low-permeability rocks
Samples for mercury injection laboratory analysis can include cores as well as cuttings. Measurements made from cuttings do not yield the same value as those from cores, so they require an empirical correction factor that ranges from 15–250 psi.[4]
Seals with low permeability and small pore throats may require longer equilibration times during mercury injection.[2]
Converting laboratory measurements
Since laboratory measurements of Pd are given in the air-mercury system rather than the oil-water or gas-water systems, we must convert from Pdm, using mercury, to Pdh, or hydrocarbons:
where:
- γ = interfacial tension, dynes/cm
- θ = contact angle or wettability, degrees
Displacement pressures measured in the air-mercury system are then converted to the hydrocarbon–water system at subsurface conditions. To convert, we must know the temperature, pressure, wettability, and coefficient of interfacial tension for the hydrocarbon phase. These parameters are commonly inferred from the composition, gas–oil ratio, and API gravity.[1] [2] For the air–mercury system, the wettability of mercury is 140° (cos 140 = 0.766). The coefficient of interfacial tension for mercury is 485 dynes/cm.[2]
See also
- Estimating displacement pressure from sedimentary facies and well logs
- Estimating displacement pressure from pore size
References
- ↑ 1.0 1.1 1.2 1.3 Schowalter, T. T., 1979, Mechanics of secondary hydrocarbon migration and entrapment: AAPG Bulletin, vol. 63, no. 5, p. 723–760.
- ↑ 2.0 2.1 2.2 2.3 Vavra, C. L., J. G. Kaldi, and R. M. Sneider, 1992, Geological applications of capillary pressure: a review: AAPG Bulletin, vol. 76, no. 6, p. 840–850.
- ↑ Katz, A. J., and A. H. Thompson, 1986, Quantitative prediction of permeability in porous rock: Physical Review Bulletin, vol. 34, p. 8179–8181., 10., 1103/PhysRevB., 34., 8179
- ↑ Sneider, R. M., and G. Bolger, 1993, Estimating seals from wireline logs of clastic seals and reservoir intervals, in J. Ebanks, J. Kaldi, and C. Vavra, eds., Seals and Traps: A Multidisciplinary Approach: AAPG Hedberg Research conference, unpublished abstract.
