Search results
Jump to navigation
Jump to search
Page title matches
- | chapter = Drilling a well ...danger involved in the combustion and explosive blast that can result from a hydrocarbon blowout.15 KB (2,385 words) - 15:05, 1 August 2016
- 18 bytes (2 words) - 21:08, 21 April 2014
- 39 bytes (4 words) - 13:28, 30 June 2014
- | author = R.A. Nelson, T.L. Patton, S. Serra For a structural play to be accepted, we must construct a coherent explanation of the mechanics or tectonics responsible for creating5 KB (738 words) - 15:58, 2 February 2022
- # Add a [[Help:Link|Link]] to an existing page, selecting a sensible [[Help:article name|article name]] # If it’s a stub, add <nowiki>{{stub}}</nowiki>644 bytes (101 words) - 19:28, 16 April 2014
- 24 bytes (3 words) - 20:05, 26 April 2014
- 45 bytes (4 words) - 21:11, 6 May 2014
- #REDIRECT [[Seismic data: building a stratigraphic model]]58 bytes (7 words) - 16:45, 21 July 2014
- 37 bytes (4 words) - 21:15, 6 May 2014
- 30 bytes (3 words) - 14:28, 8 September 2014

File:Platform A Dos Cuadras.jpg (300 × 200 (23 KB)) - 16:18, 15 January 2014- 39 bytes (4 words) - 20:22, 30 September 2014
File:444226main exoplanet20100414-a-full.jpg (1,024 × 768 (47 KB)) - 19:48, 26 January 2016- #REDIRECT [[Designing a surficial geochemical survey]]54 bytes (6 words) - 20:36, 15 April 2014
- 33 bytes (3 words) - 14:31, 19 December 2014
- #REDIRECT [[Selecting a surficial geochemistry survey method]]62 bytes (7 words) - 13:10, 9 September 2014
- 51 bytes (7 words) - 17:56, 15 January 2015
- #REDIRECT [[Help:Creating a new article]]41 bytes (6 words) - 19:28, 16 April 2014
- | chapter = Introduction to contouring geological data with a computer ...eological data is the [[contour]] map. A contour map displays variation of a geological variable, such as thickness, depth, or [[porosity]], over an are25 KB (3,597 words) - 20:49, 19 January 2022
- 35 bytes (4 words) - 21:19, 6 May 2014
- 6 members (0 subcategories, 0 files) - 16:50, 30 January 2014
- 46 bytes (5 words) - 20:00, 19 May 2014
- 45 bytes (4 words) - 19:02, 20 May 2014
- Generally speaking, there are three phases of a seismic project: ...[[seismic survey design]] and can recognize problems when they arise. Even a well-designed survey can be ruined by sloppy acquisition methods. Common cu3 KB (455 words) - 22:00, 25 January 2022
- 29 bytes (4 words) - 20:07, 21 May 2014
- 34 bytes (5 words) - 20:07, 21 May 2014
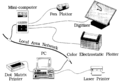
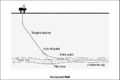
File:A-development-geology-workstation fig1.png Principal components of a development geology workstation.(1,913 × 1,312 (134 KB)) - 15:34, 14 January 2014- ...ampling design and density in target recognition], in D. Schumacher and M. A. Abrams, eds., Hydrocarbon Migration and Its Near-Surface Expression: [http Use the procedure below as a guide for designing a surface geochemical survey.6 KB (826 words) - 17:33, 25 January 2022
- | chapter = Functions of a petroleum landman The United States and the individual states have followed a legal system based on Roman law, which allows private ownership of oil and5 KB (759 words) - 19:25, 19 January 2022
- 58 bytes (5 words) - 21:01, 14 July 2014
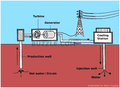
File:Simplified diagram of a geotermal plant.png (378 × 276 (96 KB)) - 16:47, 24 June 2015- ...this was flowed into the wiki incorrectly. It was originally laid out as a chart, which I interpret: *A B438 bytes (74 words) - 18:00, 15 October 2014
- | author = Dan J. Hartmann, Edward A. Beaumont ...[[Reservoir quality|pore geometry]]. Mapping S<sub>w</sub> distribution in a reservoir helps us predict trap boundaries.5 KB (687 words) - 17:09, 5 April 2022
- ...ki/Dictionary:Reflection Seismic reflections] are generated where there is a contrast in impedance (which is the product of velocity and density). ...ismogram. Velocity information can come from a variety of sources. Here is a list, in order of preference:5 KB (805 words) - 19:06, 27 January 2022
- #REDIRECT [[Water saturation distribution in a reservoir]]58 bytes (7 words) - 16:15, 27 October 2014
- How does one select a method(s) for a surface geochemical exploration program? The choice of method(s) depends on ...he survey—to demonstrate the presence of an active [[petroleum system]] in a frontier area, to high-grade previously defined exploration leads and prosp6 KB (809 words) - 17:05, 25 January 2022
- 40 bytes (4 words) - 15:25, 19 December 2014
- | author = John C. Dolson, Mike S. Bahorich, Rick C. Tobin, Edward A. Beaumont, Louis J. Terlikoski, Michael L. Hendricks ...gus, C. K., Hastings, B. S., Posamentier, H. M., Van Wagoner, J., Ross, C. A., Kendall, G. C. St. C., eds., Sea-Level Changes—An Integrated Approach:4 KB (486 words) - 14:57, 4 February 2022
- #REDIRECT [[Contouring geological data with a computer]]56 bytes (7 words) - 15:31, 18 February 2015
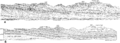
File:Developing-a-philosophy-of-exploration fig1-1.png (1,979 × 704 (257 KB)) - 16:38, 30 January 2014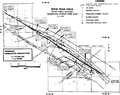
File:Developing-a-philosophy-of-exploration fig1-2.png (1,731 × 1,366 (443 KB)) - 16:41, 30 January 2014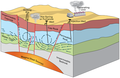
File:Simplified diagram of a geotermal power plant.png (373 × 243 (69 KB)) - 16:46, 24 June 2015
File:Developing-a-philosophy-of-exploration fig1-3.png (1,681 × 847 (80 KB)) - 16:42, 30 January 2014- 37 bytes (4 words) - 20:41, 23 September 2014
- 39 bytes (4 words) - 15:21, 19 December 2014
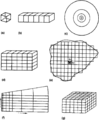
File:Conducting-a-reservoir-simulation-study-an-overview fig1.png Typical models used in reservoir simulation. (a) Zero-dimensional tank. (b) One-dimensional linear. (c) One-dimensional rad(922 × 1,118 (50 KB)) - 18:46, 14 January 2014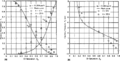
File:Conducting-a-reservoir-simulation-study-an-overview fig2.png (a) Pseudo-relative permeability and (b) capillary pressure curves calculated(1,939 × 978 (97 KB)) - 18:46, 14 January 2014- 29 bytes (3 words) - 21:52, 3 July 2014
File:Conducting-a-reservoir-simulation-study-an-overview fig3.png (926 × 1,188 (30 KB)) - 18:46, 14 January 2014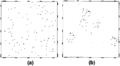
File:Introduction-to-contouring-geological-data-with-a-computer fig1.png (a) Random points. (b) Clustered points.(947 × 524 (13 KB)) - 22:06, 13 January 2014
File:Conducting-a-reservoir-simulation-study-an-overview fig4.png (926 × 1,100 (24 KB)) - 18:46, 14 January 2014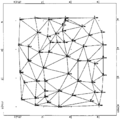
File:Introduction-to-contouring-geological-data-with-a-computer fig2.png (942 × 932 (23 KB)) - 22:06, 13 January 2014
File:Conducting-a-reservoir-simulation-study-an-overview fig5.png (854 × 1,328 (69 KB)) - 18:46, 14 January 2014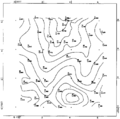
File:Introduction-to-contouring-geological-data-with-a-computer fig3.png (948 × 938 (21 KB)) - 22:06, 13 January 2014
File:Conducting-a-reservoir-simulation-study-an-overview fig6.png (931 × 813 (29 KB)) - 18:46, 14 January 2014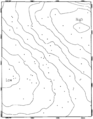
File:Introduction-to-contouring-geological-data-with-a-computer fig4.png Surface contoured on a triangular mesh. The original surface is a fourth-order polynomial.(942 × 1,209 (53 KB)) - 22:06, 13 January 2014- ...essential elements and processes of the [[petroleum system]]s in a basin. A basin such as the [[Gulf of Mexico]] can have more than one petroleum syste ...he petroleum systems within the High Island–East Breaks area. Following is a summary of the tectonic history of the basin.4 KB (518 words) - 16:35, 22 February 2022
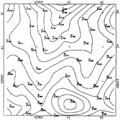
File:Introduction-to-contouring-geological-data-with-a-computer fig5.png Contours from a 13 × 13 grid using nearest neighbor search. (Data from Davis, 1973.)(943 × 946 (63 KB)) - 22:06, 13 January 2014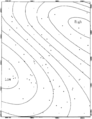
File:Introduction-to-contouring-geological-data-with-a-computer fig7.png ...the fourth-order polynomial of Figure 4 contoured on a grid prepared using a nearest neighbor search criterion.(940 × 1,218 (51 KB)) - 22:06, 13 January 2014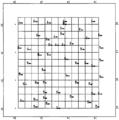
File:Introduction-to-contouring-geological-data-with-a-computer fig6.png (947 × 957 (42 KB)) - 22:06, 13 January 2014- 36 bytes (4 words) - 19:15, 27 July 2015
- A petroleum system is considered atypical if the source rock maturity is not ...systems. Methodological approaches to assessing the resource potential of a basin with an atypical petroleum systems differ and the influence and role29 KB (4,365 words) - 21:07, 21 April 2022


Page text matches
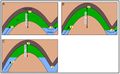
File:GumelarFigure8.jpg ...leaks from a major structure. HCH in a) has a lower height than b). c) has a spill point value that is above the crest depth so that no leakage occurs ((870 × 540 (75 KB)) - 20:33, 28 October 2021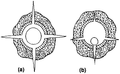
File:Well-completions fig10.png Qualitative description of perforations using (a) a casing gun and (b) a thru-tubing gun.(901 × 556 (29 KB)) - 21:20, 14 January 2014File:Introduction-to-contouring-geological-data-with-a-computer fig7.png ...the fourth-order polynomial of Figure 4 contoured on a grid prepared using a nearest neighbor search criterion.(940 × 1,218 (51 KB)) - 22:06, 13 January 2014- This template is used to identify a [[help:stub|stub]]. ==What is a stub?==403 bytes (69 words) - 14:29, 9 October 2013
- * Likes to have a solid background before starting a new project * Runs a training course for young geologists539 bytes (73 words) - 13:14, 6 August 2013
File:Well-completions fig3.png Wellbore diagram of (a) a perforated completion and (b) a single completion inside perforated casing.(940 × 683 (34 KB)) - 21:20, 14 January 2014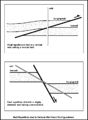
File:M91Ch13FG82.JPG ...drilled through a reverse fault or with a highly deviated well penetrating a normal fault. From Shepherd, M., 2009, Structural geology: Faults, in M. Sh(600 × 820 (92 KB)) - 21:16, 29 April 2015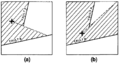
File:Using-and-improving-surface-models-built-by-computer fig15.png ...data in the hatchured area. (b) A grid node farther to the south of fault A can see more data, thus the surface smoothly changes form around the fault(926 × 491 (27 KB)) - 22:32, 13 January 2014- ...is defined as the orientation of a line at which a tilted body intersects a horizontal plane. It is usually but not always relative to north.329 bytes (49 words) - 13:47, 26 March 2015
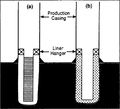
File:Well-completions fig2.png Wellbore diagram of (a) a screen and liner completion and (b) a cement liner completion.(946 × 863 (40 KB)) - 21:20, 14 January 2014
File:Figure-9.jpg ...em captures an image of each newly exposed surface. At right, a picture of a commercial FIB-SEM CrossBeam™ system, Auriga. From AAPG Memoir 102, Chapt(982 × 410 (22 KB)) - 17:35, 15 August 2014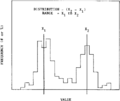
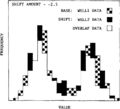
File:Log-analysis-applications fig3.png .... If node values are atypical for a given well due to tool miscalibration, a correct distribution and range can be determined and the trace normalized.(937 × 789 (19 KB)) - 16:36, 14 January 2014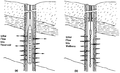
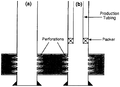
File:Well-completions fig9.png ...ting overbalanced with a casing gun and (b) perforating underbalanced with a thrutubing gun.(1,880 × 1,143 (110 KB)) - 21:20, 14 January 2014- ...;&bull;''' </code>], that is, a non-breaking space, a bullet, and a normal space. This template is used when you want a larger bullet than a [[Template:·|bold middot]] ['''·'''].428 bytes (70 words) - 14:42, 5 November 2013
File:M31F2.jpg ...n lenticular sets that form the overlying zone in a fining-upward cycle of a braided channel. C. Ripple drift bedding separated by parallel sand laminat(365 × 772 (175 KB)) - 18:56, 15 August 2014- ...g it all back in again) is called a trip. The deeper the hole, the longer a trip takes.450 bytes (82 words) - 13:57, 12 March 2019
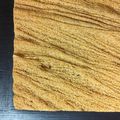
File:SandPeel.JPG A portion of a wood mounded Sand Peel.(1,280 × 1,280 (984 KB)) - 21:30, 3 July 2014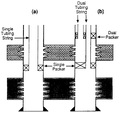
File:Well-completions fig4.png Wellbore diagram of (a) a casing-tubing dual completion and (b) a completion with dual packers and dual tubing strings.(953 × 901 (48 KB)) - 21:20, 14 January 2014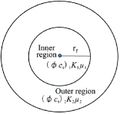
File:AlAhmadiTawfiqFigure8.jpg Schematic of a Two Region Radial Composite Reservoir (H., Li, L., & Mu, A. 2018).(312 × 297 (17 KB)) - 23:12, 9 November 2021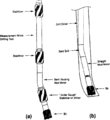
File:Wellbore-trajectory fig6.png (a) Steerable bottom hole assembly, (b) Kicking off with a bent sub and straight mud motor.(890 × 974 (33 KB)) - 21:19, 14 January 2014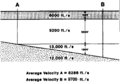
File:Mapping-with-two-dimensional-seismic-data fig2.png ...cled lines constitute a group having small misties. A group can be used as a base to which times on all other lines are adjusted. For example, times on(939 × 644 (47 KB)) - 19:36, 14 January 2014
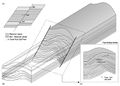
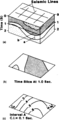
File:Evaluating-structurally-complex-reservoirs fig5.png Example of a balanced section through a complex thrust ramp structure showing both the deformed and undeformed sect(2,720 × 1,344 (81 KB)) - 18:47, 14 January 2014- This is a comment. {{{message|There is a problem with {{PAGENAME}}}}}268 bytes (33 words) - 15:38, 15 January 2014
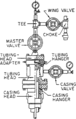
File:Surface-production-equipment fig1.png Typical wellhead for a flowing well with a single-wing, single-completion threaded manifold.(837 × 1,312 (76 KB)) - 17:29, 14 January 2014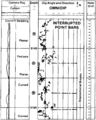
File:Dipmeters fig7.png Field example of a detailed dip computation through a sequence of interrupted meandering stream point bars.(955 × 1,189 (73 KB)) - 01:19, 14 January 2014File:Introduction-to-contouring-geological-data-with-a-computer fig4.png Surface contoured on a triangular mesh. The original surface is a fourth-order polynomial.(942 × 1,209 (53 KB)) - 22:06, 13 January 2014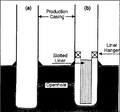
File:Well-completions fig1.png Wellbore diagram of (a) an open hole completion and (b) a slotted liner completion.(947 × 882 (40 KB)) - 21:20, 14 January 2014- ...E:{{{1|}}}}}<includeonly>[[Category:Pages which use a template in place of a magic word|N00{{PAGENAME}}]]</includeonly><noinclude>195 bytes (23 words) - 17:50, 18 January 2014
File:Pressure-detection fig3.png ...ad normal pressure. Well B, 2000 ft away and across a growth fault, showed a sudden decrease in resistivity of shale (increase in conductivity) at about(912 × 1,211 (25 KB)) - 18:23, 14 January 2014- ...inks to other articles in the wiki, further reading elsewhere, and perhaps a helpful illustration. You can see a list of all the stub articles in this wiki in [[:Category:Stubs]].1 KB (192 words) - 14:22, 9 October 2013
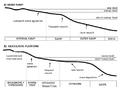
File:3.png ...ic section showing facies association A and B, by Tomassini et al. (2014). A) mixed ramp. B) siliciclastic platform.(480 × 357 (68 KB)) - 16:50, 26 June 2015- [[File:Scout Ticket.png|thumb|500px|Example of a scout ticket. Source: [http://petrowiki.org petrowiki.org] ]] ...almost none; this is called a ''tight hole''. Information that may be on a scout ticket includes location,details of drilling and casing, geologic top987 bytes (157 words) - 14:18, 4 January 2017
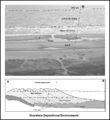
File:M31F29.jpg ...J. M., and D. B. Prior, 1981, Deltaic environments of deposition ''in'' P. A. Scholle and D. Spearing, eds., Sandstone depositional environments: AAPG M(1,161 × 1,502 (970 KB)) - 18:25, 18 August 2014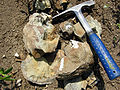
File:BrokenConcretion22.jpg ...r Cretaceous Pierre shale, near Ekalaka, Montana. Photograph taken by Mark A. Wilson (Department of Geology, The College of Wooster).(1,200 × 900 (698 KB)) - 16:20, 10 September 2014
File:M102Ch1Fg6.jpg (a) A BSE and CL image of a polished shale sample. Orange-hued quartz grains reflect low-grade ...grains indicate higher grade metamorphism (phyllite-schist). (b) Detail of a large quartz grain in center of image (arrow) displays multiple generations(502 × 518 (978 KB)) - 22:08, 14 August 2014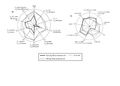
File:AlfraihAlSaifFigure7.jpg A spider diagram illustrating source parameters. A) Aliphatic hydrocarbons, b) aromatic hydrocarbons from oil inclusions and c(2,100 × 1,500 (487 KB)) - 19:15, 31 January 2022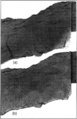
File:Sem-xrd-cl-and-xf-methods fig6.png (a) X-ray fluoroscopy slab photograph and (b) plane light slab photograph of a Pennsylvanian sandstone from Oklahoma.(1,034 × 1,598 (1.16 MB)) - 22:29, 14 January 2014
File:Seismic-migration fig5.png ...ion of the DMO-processed data shows the steep flank of the salt dome to be a particularly strong reflector.(1,021 × 2,454 (1.71 MB)) - 19:34, 14 January 2014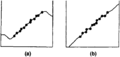
File:Using-and-improving-surface-models-built-by-computer fig3.png ...ear data values. (b) Acceptable surface extrapolation achieved by creating a first-order trend, modeling residuals between data and trend, and adding th(924 × 438 (5 KB)) - 22:32, 13 January 2014- A break or discontinuity in a process. An [[unconformity]] is the physical representation ofa temporal h217 bytes (28 words) - 20:48, 25 August 2014
File:Three-dimensional-seismic-method fig2.png {{copyright|a marine 3-D survey and (b) a time-structure map of a marker horizon derived from the 3-D volume of migrated data. (Data courtesy ...ime slices. Copyright: a marine 3-D survey and (b) a time-structure map of a marker horizon derived from the 3-D volume of migrated data. (Data courtesy(1,338 × 2,684 (369 KB)) - 19:36, 14 January 2014- ...chives.datapages.com/data/alt-browse/aapg-special-volumes/sg54.htm Energy: A historical perspective and 21st century forecast].12 members (0 subcategories, 0 files) - 17:21, 30 June 2014
- ...this was flowed into the wiki incorrectly. It was originally laid out as a chart, which I interpret: *A B438 bytes (74 words) - 18:00, 15 October 2014
- ==An image of a rock should go here== ==This is a table, yo==1 KB (211 words) - 20:59, 5 December 2013
File:M91Figure161.JPG ...generally greater than 80°, with the intent of keeping the well within a specific reservoir interval or hydrocarbon zone. From Chapter 28, AAPG Memo(800 × 534 (36 KB)) - 19:25, 30 July 2014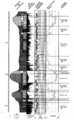
File:Log-analysis-applications fig4.png {{copyright|Schlumberger. Faciolog is a trademark of Schlumberger}} ...elationships in the data. (Traceplot. Copyright: Schlumberger. Faciolog is a trademark of Schlumberger.(1,548 × 2,509 (1.65 MB)) - 16:36, 14 January 2014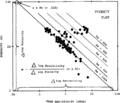
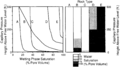
File:Log-analysis-applications fig5.png ...dentifies the cementation exponent (<italic>m</italic>) and the product of a × <italic>R</italic><sub><italic>w</italic></sub> (empirical constant × f(929 × 801 (40 KB)) - 16:36, 14 January 2014
File:M102Ch1Fg4.jpg SE2 (a) and BSE1 (b) image of a cross section of a shale rock. Note that the contrast between carbonate (ca) and silica (si) g(1,492 × 746 (1.74 MB)) - 21:56, 14 August 2014- ...t relates to capillary pressure, fluid distribution, and fluid recovery in a reservoir.]] A Buckles plot is a plot of water saturation (S<sub>w</sub>) vs. [[porosity]]. Contours of equa1 KB (183 words) - 18:19, 26 March 2015
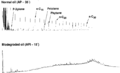
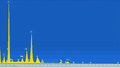
File:Oil-and-condensate-analysis fig2.png Gas chromatograms of a “normal” 35° API gravity oil and a biodegraded oil showing the lose of aliphatics (n-paraffins and isoprenoids(1,924 × 1,166 (19 KB)) - 17:17, 14 January 2014- This is a confusing term. When a reservoir is said to be dry, it is really wet - but with formation water, a204 bytes (33 words) - 16:05, 20 August 2014

File:AlotaibiFigure3.jpg A typical GC/MS system. Image source: Abdul-Hamid M. Emwas, Zeyad A. Al-Talla, Yang Yang, and Najeh M. Kharbatia. (March 2012). Gas Chromatogra(936 × 310 (48 KB)) - 21:23, 3 February 2022- ...logical-fieldwork_fig19-2.png|500px|thumb|{{figure number|1}}An example of a stratigraphic column.]] A stratigraphic column and a surface [[geologic mapping|geology map]] can show the following:533 bytes (68 words) - 13:54, 18 March 2019
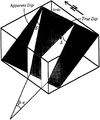
File:Conversion-of-well-log-data-to-subsurface-stratigraphic-and-structural-information fig6.png ...p between true dip of a planar surface and apparent dip of that surface in a plane at an angle of ε to the dip direction.(907 × 1,090 (57 KB)) - 16:38, 14 January 2014- Given a figure number, the template provides a bold number for the start of the caption. This way, we can easily choose to188 bytes (33 words) - 17:19, 10 September 2013
- Given a table number, the template provides a bold number for the start of the caption. This way, we can easily choose to188 bytes (33 words) - 17:20, 10 September 2013
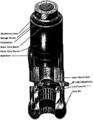
File:Conventional-coring fig2.png {{copyright|DBS, a Baroid Company}} Sponge-lined coring system. Copyright: DBS, a Baroid Company.(926 × 1,197 (85 KB)) - 22:38, 13 January 2014- All articles should start with a short, dictionary-like definition. This is a citation.<ref>This is a reference.</ref>571 bytes (74 words) - 18:30, 8 August 2013
- ...ent="Helper template for main page gallery. Takes one argument, or two for a renamed link. Option: '''size''' with units, e.g. ''size=24px''.}}</noinclu295 bytes (39 words) - 19:39, 1 April 2014
File:M91FG195.JPG ...Cretaceous, southern Chile (from Beaubouef, 2004). The lower section shows a series of idealized gamma ray logs. Reprinted with permission from the AAPG(800 × 669 (93 KB)) - 15:36, 17 August 2015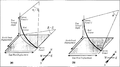
File:Conversion-of-well-log-data-to-subsurface-stratigraphic-and-structural-information fig5.png ...hod showing chords of horizontal and vertical circles. This method assumes a constant radius of curvature (constant increase or decrease in deviation be(1,968 × 1,106 (119 KB)) - 16:38, 14 January 2014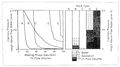
File:Charles-l-vavra-john-g-kaldi-robert-m-sneider capillary-pressure 5.jpg ...ed sequence of these rock types would show multiple oil-water contacts and a highly irregular vertical saturation profile. Note also the wide transition(1,200 × 670 (154 KB)) - 17:42, 13 September 2013
File:AlHawajAlQahtaniFigure1.jpg ...ribution of maximum principal stress that resulted from the deformation in a.(979 × 447 (95 KB)) - 20:44, 8 November 2021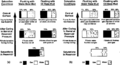
File:Core-alteration-and-preservation fig1.png ...e formation. (b) Gas-productive formation. (Courtesy of Core Laboratories, a Division of Western Atlas International}} ...e formation. (b) Gas-productive formation. (Courtesy of Core Laboratories, a Division of Western Atlas International.(1,954 × 1,054 (65 KB)) - 22:38, 13 January 2014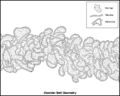
File:M91FG174.JPG ...th of point bars and clay plugs. The meander belt width is on the scale of a few hundreds of meters. Reprinted with permission from, and ©: by, the(800 × 639 (117 KB)) - 16:13, 31 July 2015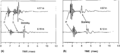
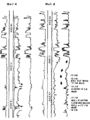
File:Full-waveform-acoustic-logging fig1.png ...icroseismograms recorded (a) at two source-receiver separations and (b) In a “soft” formation at two source-receiver separations.(1,948 × 865 (19 KB)) - 17:49, 13 January 2014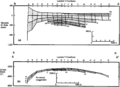
File:Geological-cross-sections fig1.png ...each unit of the Wilmington field, California. Sections are projected onto a north-south plane. (From Slatt et al., 1993.)(1,958 × 1,420 (129 KB)) - 15:32, 14 January 2014- ...as no place in a Wiki. If we want to keep this page, we could make it into a page about the entire book, but as an introduction, we will be taking out m396 bytes (66 words) - 16:18, 11 December 2013
File:Capillary-pressure fig5.png ...ed sequence of these rock types would show multiple oil-water contacts and a highly irregular vertical saturation profile. Note also the wide transition(1,805 × 1,011 (101 KB)) - 18:22, 14 January 2014- ...the template for numbers and units only, not 'ago' as well. Remember: Make a change here and everywhere this template is called with the default units,391 bytes (63 words) - 13:55, 5 November 2013
- ...on for oil and gas, but in some places fractured basement has proven to be a commercial reservoir.264 bytes (40 words) - 15:52, 10 March 2016
- ...a multilateral well. A well with two productive laterals is referred to as a dual [[lateral]] well. Mth14ch00f01.jpg|Simple vertical profile of a horizontal well, illustrating basic terms.1 KB (187 words) - 15:44, 26 April 2016
File:Log-analysis-applications fig7.png ...her by shifting the second well's data across the base well on the screen. A visual best fit is usually satisfactory for determining the amount of norma(925 × 838 (28 KB)) - 16:36, 14 January 2014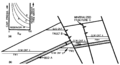
File:Fluid-contacts fig5.png ...free water surface and oil-water contact. The displacement pressure of bed A causes the contact elevation difference between contacts 1 and 2. The displ(1,908 × 1,034 (76 KB)) - 01:52, 14 January 2014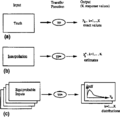
File:Monte-carlo-and-stochastic-simulation-methods fig1.png ...ed by a series of equiprobable input sets which, after processing, provide a probability distribution (pdf) for the response value(s).(923 × 900 (12 KB)) - 20:28, 14 January 2014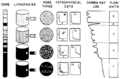
File:Flow-units-for-reservoir-characterization fig1.png ...r no flow through it. This property of flow units makes it possible to use a single numbering system for identifying both obvious flow units and probabl(1,487 × 976 (91 KB)) - 23:13, 14 January 2014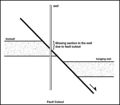
File:M91Ch13FG81.JPG The stratigraphy in a well penetrating a normal fault will be incomplete due to fault cutout. From Shepherd, M., 200(600 × 525 (31 KB)) - 21:15, 29 April 2015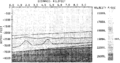
File:Forward-modeling-of-seismic-data fig1.png A strike cross section of a carbonate reef play. The reef structure on the left contains porosity, whil(1,946 × 1,028 (96 KB)) - 14:35, 14 January 2014
File:M31F28.jpg ...J. M., and D. B. Prior, 1981, Deltaic environments of deposition ''in'' P. A. Scholle and D. Spearing, eds., Sandstone depositional environments: AAPG M(1,230 × 1,012 (1.84 MB)) - 18:24, 18 August 2014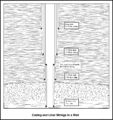
File:M91Ch2FG6.JPG ...ons of the hole before drilling further. From Shepherd, M., 2009, Drilling a well, in M. Shepherd, Oil field production geology: AAPG Memoir 91, p. 7-12(800 × 847 (167 KB)) - 17:01, 22 April 2015
File:Figure-8.jpg A secondary electron image of a shale sample with an EDS-derived mineral segmentation overlay. In the segme(1,353 × 418 (106 KB)) - 17:34, 15 August 2014
File:Porosity fig1.png ...tes: *lf sample is completely disaggregated during measurement. “Varies as a function of height above the free water level.) (After Eslinger and Pevear,(1,942 × 983 (76 KB)) - 18:19, 14 January 2014- ...data/specpubs/beaumont/ch10/ch10.htm Evaluating top and fault seal], in E. A. Beaumont and N. H. Foster, Exploring for Oil and Gas Traps: [http://store.990 bytes (151 words) - 14:30, 27 January 2016
File:M102Ch1Fg7.jpg ...rom a shale sample. Individual peaks indicate an elevated concentration of a given element. C=carbon, O=oxygen, Mg=magnesium, Al=aluminum, Si=silicon, C(1,492 × 845 (1.24 MB)) - 22:24, 14 August 2014- | {{{data|}}} <!--Not a number, return "data" as is--> | {{{ {{{data|}}} |}}} <!--"data" is a number, return that numbered parameter-->184 bytes (21 words) - 13:00, 6 August 2013
File:M91FG191.JPG ...s a shoreface profile on St. Cyrus Beach, Scotland. The beach is just over a hundred meters wide. Reservoir properties are influenced by the degree of w(800 × 873 (118 KB)) - 21:14, 12 August 2015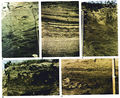
File:M31F5.jpg Photographs of bedding in a meander point bar. A. Cyclic flood deposits in a point bar. B. Small-scale cross-stratification and organic debris. C. Climb(1,152 × 941 (941 KB)) - 19:33, 15 August 2014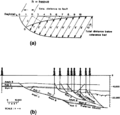
File:Evaluating-structurally-complex-reservoirs fig4.png ...fault trajectory. Interpolation between these points is carried out using a half grid spacing. (b) Fault trajectory reconstruction by the Groshong (198(951 × 915 (46 KB)) - 18:47, 14 January 2014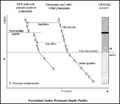
File:M91Ch06FG44.JPG ...where the reservoir may be separating into zones of different pressures as a result of depletion. From Shepherd, M., 2009, Sources of data, in M. Shephe(800 × 696 (58 KB)) - 17:11, 3 June 2015- ...datapages.com/data/specpubs/beaumont/ch02/ch02.htm What is a trap?], in E. A. Beaumont & N. H. Foster, eds., [http://store.aapg.org/detail.aspx?id=545 E .../ch09/ch09.htm Predicting reservoir system quality and performance], in E. A. Beaumont & N. H. Foster, eds., [http://store.aapg.org/detail.aspx?id=545 E1 KB (206 words) - 17:37, 27 January 2015
File:GumelarFigure4.jpg ...be complex. (c) Allan's Mapping technique resolves the fault surface into a flat plane and maps the position of the footwall and hanging-wall. The trap(652 × 468 (90 KB)) - 21:13, 28 September 2021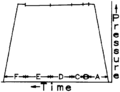
File:Drill-stem-testing fig7.png Perfect chart. Blanked off gauge below the bottom packer on a straddle test. (A) running in hole; (B) initial flow period; (C) initial buildup; (D) final f(728 × 559 (6 KB)) - 22:25, 14 January 2014
File:M91Ch11FG70.JPG ...e underlying Ivan limestone as picked out by varying seismic amplitudes on a horizon display, late Pennsylvanian to Early Permian, Baylor County, Texas(600 × 353 (134 KB)) - 15:46, 27 April 2015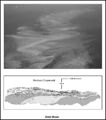
File:M91FG196.JPG ...nts a 4.5-km (2.7 mi)-wide transect. The lower inset is an illustration of a cliff exposure of laterally accreting (shingled) oolites from the Lower Cre(800 × 909 (88 KB)) - 13:08, 20 August 2015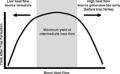
File:H4CH12FG8.JPG ...ature present day and a limited amount of hydrocarbon is generated, and at a high heat flow, the source rock is depleted before the trap forms. From Ide(600 × 372 (49 KB)) - 20:32, 13 July 2015- | author = Edward A. Beaumont and Norman H. Foster ...itical elements of traps in a petroleum system, evaluating the elements of a petroleum province, and methods for predicting reservoir occurrence, qualit424 members (0 subcategories, 0 files) - 17:43, 24 January 2022
- ...e in a targeted, potentially productive interval. In a single-branch case, a lateral runs from the end of the [[bend (curve)|curve]] ([[heel]]) to the [ [[file:Mth14ch00f01.jpg|thumb|center|500px|Simple vertical profile of a horizontal well, illustrating basic terms.]]1 KB (185 words) - 13:56, 17 March 2016
File:Mapping-with-two-dimensional-seismic-data fig6.png (a) Block diagram showing the time that Is mapped for a time slice map. (b) Interval that is mapped on time interval map. (c) Time(909 × 1,853 (102 KB)) - 19:36, 14 January 2014
File:M91FG67.JPG ...eservoir segments. However, this type of geometry is easy to overlook, and a layer-cake geometry is often erroneously imposed (from Sneider and Sneider,(800 × 894 (74 KB)) - 13:18, 20 August 2015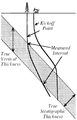
File:Conversion-of-well-log-data-to-subsurface-stratigraphic-and-structural-information fig2.png ...pping stratigraphic unit are shown in relation to the measured interval in a well penetrating the unit.(911 × 1,424 (111 KB)) - 16:38, 14 January 2014


