Search results
Jump to navigation
Jump to search
- -->{{#ifeq:{{{2|x}}}|{{{2|}}}| |{{{2}}} | }}<!-- -->{{#ifeq:{{{3|x}}}|{{{3|}}}| |{{{3}}} | }}<!--656 bytes (57 words) - 17:32, 4 November 2013
- {{#if:{{{2|<noinclude>x</noinclude>}}} |<p style="text-align: right;"> — {{{2}}}{{#if:{{{3|<noinclude>x</noinclude>}}}485 bytes (53 words) - 01:15, 14 January 2014
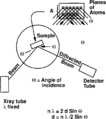
File:Sem-xrd-cl-and-xf-methods fig2.png X-ray diffraction configuration. Knowledge of the wavelength (X) and angle of incidence allows the ''d'' spacing to be calculated.(933 × 1,051 (19 KB)) - 22:29, 14 January 2014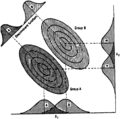
File:Multivariate-data-analysis fig1.png ...ps A and B along both variables <italic>x</italic><sub>1</sub> and <italic>x</italic><sub>2</sub>. Groups can be distinguished by protecting members of(957 × 948 (85 KB)) - 00:51, 14 January 2014- -->{{#ifeq:{{{2|x}}}|{{{2|}}}| |{{{2}}} }}<!-- -->{{#ifeq:{{{3|x}}}|{{{3|}}}| |{{{3}}} }}<!--1 KB (94 words) - 18:28, 18 January 2014
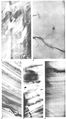
File:M31F27.jpg ...aph of disturbed structures in mudflow deposit that caps a slump block. E. X-ray radiograph of core in normally deposited marine clays, which often cap(760 × 1,372 (583 KB)) - 18:23, 18 August 2014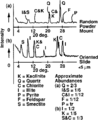
File:Sem-xrd-cl-and-xf-methods fig3.png X-ray diffraction patterns.(925 × 1,134 (21 KB)) - 22:29, 14 January 2014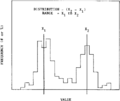
File:Log-analysis-applications fig3.png ...odes in a trace's data values (<italic>x</italic><sub>1</sub>, and <italic>x</italic><sub>2</sub>) within a given formation are related to geology. Node(937 × 789 (19 KB)) - 16:36, 14 January 2014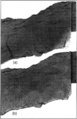
File:Sem-xrd-cl-and-xf-methods fig6.png (a) X-ray fluoroscopy slab photograph and (b) plane light slab photograph of a Pe(1,034 × 1,598 (1.16 MB)) - 22:29, 14 January 2014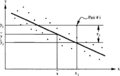
File:Correlation-and-regression-analysis fig1.png Linear regression of ''x''-on-''y''. Note the negative slope corresponding to a negative correlation(942 × 598 (16 KB)) - 18:39, 14 January 2014
File:M31F7.jpg ...nt. Organic stringers and peat deposits are common in this environment. I. X-ray radiograph of core taken in backswamp deposit. Note the stringers of or(1,366 × 1,004 (1.31 MB)) - 19:50, 15 August 2014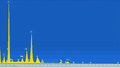
File:M102Ch1Fg7.jpg An example of an x-ray spectrum acquired from a shale sample. Individual peaks indicate an ele(1,492 × 845 (1.24 MB)) - 22:24, 14 August 2014
File:CN24FG3.jpg ...d transmission electron micrograph of a calcium dolomite (Ca1.12Mg0.88(CO2)x) of Eocene age. The prominent modulated structure is typical of sedimentary(496 × 611 (128 KB)) - 20:47, 15 July 2015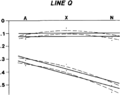
File:Mapping-with-two-dimensional-seismic-data fig1.png ...d when misties are averaged. Dots show times of events on seismic lines A, X, and N where those lines intersect line Q. Solid lines show true attitude o(945 × 749 (19 KB)) - 19:36, 14 January 2014- ...{{{|safesubst:}}}#ifexpr:{{{1|1}}}>1|{{{{{|safesubst:}}}#ifeq:x{{{3|}}}x|x x||{{{{{|safesubst:}}}#if:{{{2|}}}||<nowiki></nowiki>}}}} ...{{{|safesubst:}}}#ifexpr:{{{1|1}}}>2|{{{{{|safesubst:}}}#ifeq:x{{{3|}}}x|x x||{{{{{|safesubst:}}}#if:{{{2|}}}||<nowiki></nowiki>}}}}9 KB (1,172 words) - 01:16, 14 January 2014
- | isbn = 0-89181-602-X ...wells represent Marmaton wells; triangles, Mississippian wells; and large X's, study wells. The rest of the oil wells produce from the Morrow. Each uni3 KB (429 words) - 14:19, 11 April 2022
- ...sion-analysis fig1.png|300px|thumb|{{figure number|1}}Linear regression of x-on-y. Note the negative slope corresponding to a negative correlation. The ...tween two quantities or variables, that is, the tendency for one variable, x, to increase or decrease as the other, y, increases or decreases, in a stra9 KB (1,366 words) - 16:37, 19 January 2022
File:H4CH12FG4.JPG Burial history curve for location X represented by the dot in Figure 2 of [[Basin modeling: identifying and qua(600 × 369 (82 KB)) - 20:20, 9 July 2015- ...al in a carbonate rock can be determined by [[SEM, XRD, CL, and XF methods|X-Ray Diffractometry]]. Carbonates more rich in calcite and/or aragonite are708 bytes (95 words) - 20:42, 7 July 2016
- | isbn = 0-89181-602-X ...y'') are available from the seismic data cube, ''t''(''x, y'') and ''a''(''x, y''). The traveltimes form a time structure map, and the amplitudes are a7 KB (1,117 words) - 17:51, 25 January 2022


