Search results
Jump to navigation
Jump to search
- * Parameter 3: Date (month year, e.g. {{#time:F Y}}. Usually the "date" parameter of the calling template <code><nowiki>{{{da ...too technical from {{#time:F Y|-1 month}}]], if the date is set {{#time:F Y|-1 month}} e.g. If such a category does not exist, or the date was set inco3 KB (550 words) - 20:59, 14 January 2014
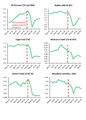
File:Figure2 2019-20 Comm Rept.jpg ...ht oil plays. Data source: U.S. EIA, U.S. Tight oil production report (all y-axis values in millions of bbls/day).(1,500 × 2,100 (517 KB)) - 18:57, 5 April 2021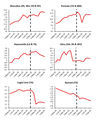
File:Figure3 2019-20 Comm Rept.jpg ...ht gas plays. Data source: U.S. EIA, U.S. Tight gas production report (all y-axis values in billions of scf/day).(1,500 × 1,875 (495 KB)) - 19:34, 5 April 2021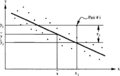
File:Correlation-and-regression-analysis fig1.png Linear regression of ''x''-on-''y''. Note the negative slope corresponding to a negative correlation. The reg(942 × 598 (16 KB)) - 18:39, 14 January 2014- ...analysis fig1.png|300px|thumb|{{figure number|1}}Linear regression of x-on-y. Note the negative slope corresponding to a negative correlation. The regre ...s, the tendency for one variable, x, to increase or decrease as the other, y, increases or decreases, in a straight-line trend or relationship.<ref name9 KB (1,366 words) - 16:37, 19 January 2022
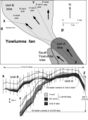
File:Mth14ch02f05.jpg Map with cross sections X-Z and Y-Z showing basinward-stepping geometries exhibited by lobe-shaped sand bodie(500 × 682 (64 KB)) - 17:07, 4 December 2015- ...) are available from the seismic data cube, ''t''(''x, y'') and ''a''(''x, y''). The traveltimes form a time structure map, and the amplitudes are a hor ...ties are posted to a map and [[contour]]ed or gridded to create ''υ''(''x, y'').7 KB (1,117 words) - 17:51, 25 January 2022
- ...nts]].) The E<sub>x</sub> component is oriented perpendicular to the E<sub>y</sub> component. This is also true for the H-field components. ...e information on the subsurface geology (when only H<sub>x</sub> and H<sub>y</sub> components are measured), the vertical H-field component—if measure5 KB (706 words) - 15:11, 31 January 2022
- Dong, T., He, S., Chen, M., Hou, Y., Guo, X., Wei, C., Han, Y., Yang, R., 2019. Quartz types and origins in the Paleozoic Wufeng-Longmaxi He, Z., Nie, H., Hu, D., Jiang, T., Wang, R., Zhang, Y., Zhang, G., Lu, Z., 2020. Geological problems in the effective development7 KB (985 words) - 18:54, 4 December 2023
- <code><nowiki>{{box-shadow | X-offset | Y-offset | blur radius | #color}}</nowiki></code> * <code>X-offset</code> and <code>Y-offset</code> – Specify the offset of the shadow to the right and below t3 KB (378 words) - 15:10, 5 November 2013
- 3.Hao, F., X. Zhou, Y. Zhu, and Y. Yang, 2011, Lacustrine source rock deposition in response to coevolution o 5.Ma, Y., M. Fan, Y. Lu, H. Liu, Y. Hao, Z. Xie, L. Peng, X. Du, and H. Hu, 2017, Middle Eocene paleohydrology8 KB (1,251 words) - 15:51, 14 March 2022
- ..., using the formula <math>\text{V} = \text{A} \times \text{T} \times \text{Y} \times \text{M}</math>, where: #* ''Y'' = hydrocarbon yield per volume of source from each [[kerogen]] facies and6 KB (834 words) - 20:41, 14 February 2022
- ...emperature) can be measured, so we have temperature as a function of (''x, y, z''). As we move around the room to other points, the temperature changes ...resenting a measurement (amplitude, for example). Each number has an (''x, y, z'') position in the box. For any point in the middle of the box, three pl5 KB (813 words) - 19:05, 27 January 2022
- ...umulations.<ref name=ch10r13>Chong, K. P., P. M. Hoyt, J. W. Smith, and B. Y. Paulsen, 1980, Effects of strain rate on oil shale fracturing: Internation ...<ref name=ch10r13>Chong, K., P., Hoyt, P., M., Smith, J., W., Paulsen, B., Y., 1980, Effects of strain rate on oil shale fracturing: International Journ4 KB (598 words) - 19:47, 24 March 2022
- ...term for relating two sets of variables. The first set, usually denoted by y, constitutes the dependent variables(s). It is related linearly to the seco ...ities, called ''principal component variables:'' ''y''<sub>1</sub>, ..., ''y''<sub>P<sub>0</sub></sub>, ''P''<sub>0</sub> ≤ P.16 KB (2,349 words) - 15:46, 19 January 2022
- ...ns are at least [[length::250 m]].y. old—maybe as old as [[length::300 m]].y.5 KB (782 words) - 22:36, 31 January 2022
- ...ismic data (with time axis) converted to a depth cube using a ''V'' ( ''X, Y, Z'' ) velocity model2 KB (320 words) - 19:10, 27 January 2022
- ...ine and P<sub>c</sub> curve, read the corresponding value for ''r'' on the Y-axis ...>c</sub> curve, read the corresponding value for P<sub>c</sub> on the left Y-axis6 KB (898 words) - 16:21, 4 April 2022
- ...ation and Development Online, vol. 39, no. 6, p. 657–667.</ref><ref>Zhang, Y., X. Qi, X. Cheng, and Z. Luo, 2007, Approach to sedimentary environment of6 KB (850 words) - 17:56, 20 December 2023
- ...a, C. Arregui, O. Carbone, J. C. Daniela, and J. M. Vallés, eds., Geología y Recursos Naturales de la Provincia del Neuquén, Neuquén, p. 113–129.</r ...con especial referencia a la Formación Vaca Muerta entre los Paralelos 35º y 40º l.s. Cuenca Neuquina-Mendocina: Revista de la Asociación Geológica A16 KB (2,490 words) - 15:32, 8 January 2021


