Mapping unconformities
| Exploring for Oil and Gas Traps | |

| |
| Series | Treatise in Petroleum Geology |
|---|---|
| Part | Predicting the occurrence of oil and gas traps |
| Chapter | Exploring for stratigraphic traps |
| Author | John C. Dolson, Mike S. Bahorich, Rick C. Tobin, Edward A. Beaumont, Louis J. Terlikoski, Michael L. Hendricks |
| Link | Web page |
| Store | AAPG Store |
Mapping unconformities (sequence boundaries) is part of an effective exploration effort. Facies, porosity systems, and hydrocarbon shows are evaluated in context with an unconformity surface to predict trap location. Traps can be located above (onlap traps) or below (truncation traps) the unconformity. Seals, reservoir-quality rocks, and shows should be evaluated in terms of their relationship to the unconformity.[1]
Procedure: mapping unconformities[edit]
Follow these suggested steps to map unconformities for prospects.
- Map subcrop and supercrop lithology and formations.
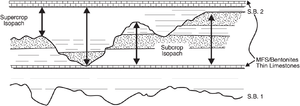
- Make an isopach map from the unconformity to a flat datum above or below the unconformity to define paleotopography or paleostructure (see Figure 1).
- Identify the best locations for truncation or onlap traps on the basis of the location seal and reservoir-quality rocks.
Making isopachs[edit]
The diagrammatic cross section in Figure 1 shows how to isopach above and below an unconformity. For more explanation, see Busch.[2]
Subcrop and facies mapping example[edit]

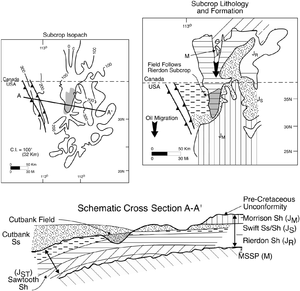
The Lower Cretaceous Cutbank Sandstone is the largest valley-fill trap in the Rocky Mountains (180 million BOE recoverable).[3] The trap (illustrated below) is a combination valley wall and fossil oil-water contact trap. In this example, a flat datum within the Jurassic Sawtooth Formation was picked as the lowermost datum. Where the Sawtooth Formation is absent by onlap, the erosional top of the Mississippian was used, introducing some error on a local scale. “Thicks” are generally paleohills, and “thins” are incised valleys, although the “thick” to the west of the field is also caused by syndepositional westward thickening of the Jurassic section.
Figure 2 contains subcrop isopach and formation/lithology maps and a cross section whose location is shown on the isopach map. Dashed and hachured areas are shale; stippled areas are sandstone. The arrows on cross section A-A′ show the subcrop isopach interval. The north-south trending isopach thin and shaded area on the maps shows the location of the giant Cutbank field.
Using subcrop maps to analyze seals[edit]
The subcrop lithology and formation map in Figure 2 illustrates where regional bottom and lateral seals are located. The trap is found where the porous Cutbank Sandstone abuts impermeable Jurassic shales. Where the Cutbank Sandstone abuts the permeable Swift Sandstone, leakage occurs updip. Oil migrates into the Cutbank where the valley bevels northward into a migration path at the top of the Mississippian strata.
Using subcrop maps to predict valley fill[edit]
Subcrop maps also help us predict lithologic content of the supercropping valley networks. In the example above, fine-grained sandstone and shale entered the Cutbank system from the east and south from eroding hills comprised of fine-grained Morrison and Swift strata. Coarse-grained gravels are confined exclusively to the main alluvial-fan system that eroded Paleozoic strata to the west.
In the Muddy Formation of the Western Interior of the United States, many shale-filled valleys occur where local tributaries have only subcropping Skull Creek Shale for a provenance. These valleys can form seals for subcropping reservoirs.[4][1] Within deep basins, where the location of coarse gravels may be a primary reason to retain or create porosity, accurate regional reconstructions of erosional networks and their provenance areas are a must.[5]
If the sequences are thick enough to image, chaotic seismic signatures within the valley may also suggest reservoir fill; smooth, parallel reflectors suggest shale fill.
See also[edit]
- Basin-fill and trap analysis
- Procedure for basin-fill analysis
- Mapping paleogeography
- Analyzing depositional sequences for traps
References[edit]
- ↑ 1.0 1.1 Dolson, J. C., and D. S. Muller, 1994, Stratigraphic evolution of the Lower Cretaceous Dakota Group, Western Interior, USA, in M. V. Caputo, J. A. Peterson, and K. J. Franczyk, eds., Mesozoic Systems of the Rocky Mountain Region, USA.: SEPM Rocky Mountain Section, p. 441–456.
- ↑ Busch, D. A., 1974, Stratigraphic Traps in Sandstone—Exploration Techniques: AAPG Memoir 21, 174 p.
- ↑ 3.0 3.1 Gries, R., J. C. Dolson, and R. G. H. Reynolds, 1993, Structural and stratigraphic evolution and hydrocarbon distribution, Rocky Mountain Foreland, in R. W. Macqueen, and D. A. Leckie, eds., Foreland Basins and Fold Belts: AAPG Memoir 55, p. 395–425.
- ↑ Dolson, J. C., ed., 1991, Unconformity Related Hydrocarbon Exploitation and Accumulation in Clastic and Carbonate Settings: Rocky Mountain Assoc. of Geologists and Exploration Geoscience Institute (Colorado School of Mines) Core Workshop, Golden, Colorado, 297 p.
- ↑ Putnam, P. E., and T. A. Oliver, 1980, Stratigraphic traps in channel sandstones in the Upper Mannville (Albian) of east-central Alberta: Canadian Society of Petroleum Geologists Bulletin, vol. 28, p. 489–508.
