Petrophysical analysis of Sorrento field wells
| Exploring for Oil and Gas Traps | |

| |
| Series | Treatise in Petroleum Geology |
|---|---|
| Part | Predicting the occurrence of oil and gas traps |
| Chapter | Predicting reservoir system quality and performance |
| Author | Dan J. Hartmann, Edward A. Beaumont |
| Link | Web page |
| Store | AAPG Store |
Well 11 flow units
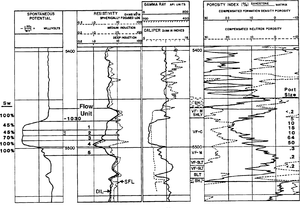
Flow units were determined in well 11 by plotting and grouping routine core data. The top and bottom of the Morrow (flow units A and 5) are microporous, low-permeability sandstones that are wet but too tight to produce. Between these are length::30 ft depth::(8.5 m) of mesoto macroporous sandstone (flow units 1-4).
All pertinent petrophysical data for well 11 are summarized on Figure 1. Sandstone descriptors found on porosity logs are as follows:
- VF = very fine grained
- F = fine grained
- M = medium grained
- C = coarse grained
- VC = very coarse grained
- SHY = shaly
- SLTY = silty
- SLT = siltstone
- SH = shale
Subsea elevation of –1,030 ft (–314 m) is marked in the depth track.
Well 11 water saturations
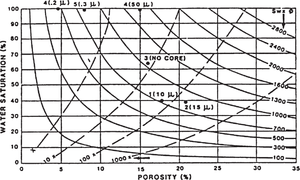
Flow unit 4 is macroporous but wet (Sw = 100%); this indicates an oil-water contact. Flow unit 3 is macroporous and has intermediate water saturation (Sw = 70%). This looks like a transition zone. Flow units 2 and 1 are mesoporous and are at immobile water saturation (Sw = 45%). This is verified by the well testing about 100 bo/d and 300 Mcfg/d (16 m3 oil and 8,500 m3gas per day) with no water from perforations in these flow units and by a bulk-volume-water plot following. This lack of water production is remarkable, considering that the well lies only about length::25 ft (7 m) above the free water level.
Figure 2 is the bulk-volume-water (Buckles) plot for well 11.
Well 4
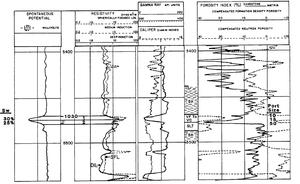
Well 4 hit the Morrow near the top of the oil column. It had the lowest saturations and best flow rates of all the wells studied, even though it had the thinnest reservoir. This is because it contained rock with large pore throats (r35 up to 50μ) that was fully saturated with oil (Sw = 25-30%). The well tested 230 bo/d and 387 Mcfg/d (37 m3 oil and 11,000 m3 gas per day). Initial production was 51 bo/d and 411 Mcfg/d (8 m3 oil and 12,000 m3 gas per day). The difference could be due to a loss of reservoir thickness near the well bore, judging from the thinness of the reservoir.
Figure 3 summarizes the petrophysical characteristics of well 4.
Well 8
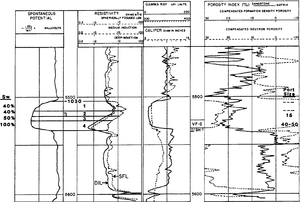
Wells 8 and 1 both are interpreted as encountering transition zones, based on porosity types and log-calculated saturations. Well 8 encountered the Morrow just above the water level. Pore throats are meso- to macroporous. The two upper flow units probably are close to immobile water saturation. However, the two basal zones (3 and 4) have high saturations of mobile water. This explains why the well cut water on initial potential testing. This water production should increase with time as the water leg rises.
Figure 4 summarizes the petrophysical characteristics of well 8.
Well 1
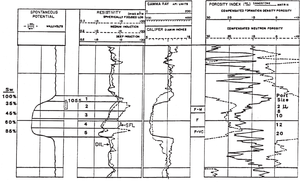
Well 1 is similar to well 8, except that flow unit 2 of well 1 shows an anomalous low resistivity. The interval tested 32 bo/d and 15 Mcfg/d (5 m3 oil and 425 m3 gas per day) with no water. Therefore, the zone by definition is at immobile water saturation (Swi = 40%). The discrepancy suggests that the log resistivity was too low due to bed resolution problems. If true resistivity is 9 ohm-m2/m (used for the calculation), then the true water saturation is less than 40%.
Caveat
While these petrophysical methods of analyzing wells are reliable and widely applicable in water-wet reservoirs, there is at least one source of potential error: the assumption that there are no lithologic changes that affect log-calculation parameters without affecting permeability-porosity relationships. Examples include vuggy or fracture porosity and variable shale effects. If such changes occur, then we must modify the relationships between calculated saturations and producibility.
See also
- Evaluation of saturation profiles
- Setting and structure of the Sorrento field
- Morrow lithofacies and pore types
- Sorrento water saturation calculations
- Water saturation profile for Sorrento field
References
- ↑ 1.0 1.1 1.2 1.3 1.4 Hartmann, D. J., and E. B. Coalson, 1990, Evaluation of the Morrow sandstone in Sorrento field, Cheyenne County, Colorado, in S. A. Sonnenberg, L. T. Shannon, K. Rader, W. F. von Drehle, and G.W. Martin, eds., Morrow Sandstones of Southeast Colorado and Adjacent Areas: RMAG Symposium, p. 91-100.