Stratigraphic predictions from computer simulation
| Exploring for Oil and Gas Traps | |

| |
| Series | Treatise in Petroleum Geology |
|---|---|
| Part | Critical elements of the petroleum system |
| Chapter | Sedimentary basin analysis |
| Author | John M. Armentrout |
| Link | Web page |
| Store | AAPG Store |
Computer simulation can help us predict lithofacies and hydrocarbon occurrence between and beyond data control. Both 2-D and 3-D simulation programs are available or in development. With high-resolution input of chronostratigraphy, lithofacies, and sedimentary process rates, simulations can be constructed that interpolate and extrapolate distributions of potential organic-rich source rock, seal rock, and reservoir rock.
Sedimentation model
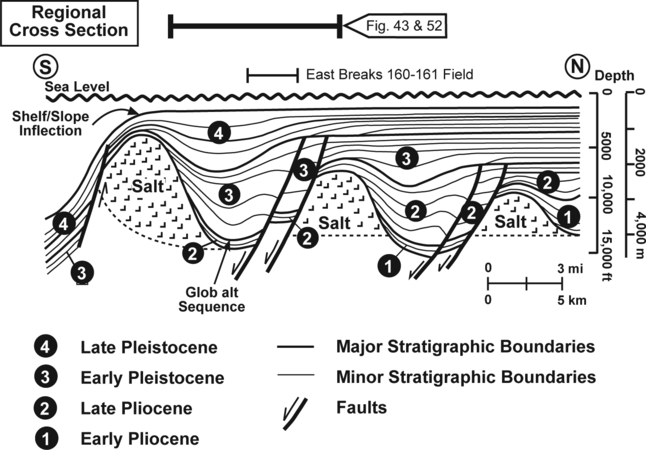
Figure 2 Schematic diagram of the seismic reflection profile along the west side of the East Breaks 160-161 field. From Armentrout and Clement;[3] courtesy Gulf Coast SEPM.
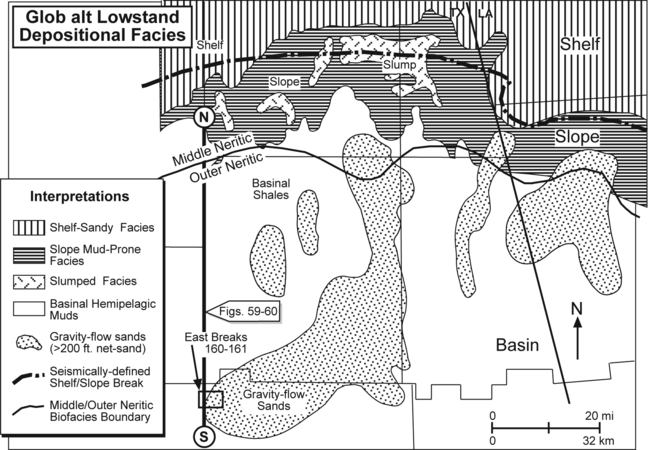
Figure 3 Sepositional facies map for the Glob alt interval’s basal sequence boundary, constructed by integrating the biofacies map, the net sandstone map, and the seismic facies map. After Armentrout;[2] courtesy Springer-Verlag.


Figure 1 is from a simulation done by Rouch et al.[1] for the seismic reflection profile transect in Figure 2 (location on Figure 3). The detailed calibration of that seismic profile using wireline logs, well-cuttings lithofacies, and biostratigraphic data provides a high-resolution data set.
The data were input in a commercially available simulation package that performs 2-D backstripping and calculates subsidence rates and sediment flux rates across the entire seismic profile. Using a spectrum of input parameters based on regional geology and including those calculated from the backstripping exercise, the simulation fills in each polygon defined by digitized maximum flooding surface horizons with geologically appropriate lithofacies. The digitized horizons and the degree of fit between the simulated sedimentary record and the input data are shown below. Areas where the simulation shows excess sediment accumulation compared to the known record are noted by striped black patterns above the digitized flooding horizon; areas where the simulation shows less sediment accumulation than the known area are noted by solid gray areas below the digitized flooding horizon. The figure is the end result of 24 simulation runs converging toward a best-fit answer[1]
Model refinement
The difference between the simulation predictions and the known geology lets us focus on specific areas and processes to refine the model. Analysis of subsidence rates, paleobathymetry, fluvial and coastal gradients, volume of sediment bypassing the area (slope stability factor), slumping, and gravity-flow transport must be considered.
Lithofacies simulation

Once the best-fit simulation for most areas is achieved, lithofacies can be simulated. The resulting simulation displays a spectrum of lithofacies types based on the computer program. These predictions can be tested against the well data lithofacies and further finetuning performed. Once the best-fit lithofacies simulation is achieved, it can be used to infer the distribution of source, seal, and reservoir rock between well control and beyond into undrilled areas.
Using different computer packages
Continuing development of the simulation package used by Rouch et al.[1]) is focused on predicting organic richness, maturation, porosity, and fluid flow, as well as converting the lithofacies distributions into synthetic seismic reflection profiles that can be compared to profiles generated from field data. Each of the simulations must be checked against available data. Several simulations, each using different computer programs, clarify prediction reproducibility. Development of 3-D simulation programs will further enhance the predictions based on well-constrained data sets.
Integrating basin history
All of these efforts—gathering and integrating empirical data, computer simulation of geologic processes, and prediction of specific lithofacies—must be evaluated within the context of the basin history. The future success of geologic analysis is dependent on our careful and accurate interpretation of basin history from regional to local scales.
See also
- Exploration strategy for deep-water sands
- East Breaks petroleum geology
- East Breaks deep-water exploration strategy
References
- ↑ 1.0 1.1 1.2 1.3 Rouch, L., S., Armentrout, J., M., Bowman, S., A., 1993, Iterative analysis of depositional sequences: computer simulation of seismically defined geometries, south Galveston and East Breaks areas, Gulf of Mexico: Proceedings, Gulf Coast Section SEPM 14th Annual Research conference, p. 195–207.
- ↑ 2.0 2.1 2.2 Armentrout, J., M., 1991, Paleontological constraints on depositional modeling: examples of integration of biostratigraphy and seismic stratigraphy, Pliocene–Pleistocene, Gulf of Mexico, in Weimer, P., Link, M., H., eds., Seismic Facies and Sedimentary Processes of Submarine Fans and Turbidite Systems: New York, Springer-Verlag, p. 137–170.
- ↑ Armentrout, J. M., and J. F. Clement, 1990, Biostratigraphic calibration of depositional cycles: a case study in High Island–Galveston–East Breaks areas, offshore Texas: Proceedings, Gulf Coast Section SEPM 11th Annual Research Conference, p. 21–51.
External links
| find literature about Stratigraphic predictions from computer simulation |