Search results
Jump to navigation
Jump to search
There is a page named "Shale" on this wiki. See also the other search results found.
Page title matches
- ==Shale smear factor== Shale Smear Factor Fig1.png|{{figure number|1}}Field example of clay smears separ8 KB (1,307 words) - 16:05, 14 December 2016
- #REDIRECT [[Fault seal quantitative prediction: shale smear factor, shale gouge ratio, and smear gouge ratio]]110 bytes (15 words) - 21:32, 29 September 2014
- [[File:ShaleUSGOV.jpg|thumb|300px|Shale.]] * [[Wikipedia:Shale|Shale (Wikipedia)]]245 bytes (30 words) - 20:16, 21 April 2015
- #REDIRECT [[Barnett shale play]]32 bytes (4 words) - 19:22, 14 March 2019
- 126 bytes (15 words) - 13:53, 5 September 2014
- | title = Shale tectonics | chapter = Shale tectonics: a preface17 KB (2,466 words) - 16:16, 10 January 2024
- An oil shale is defined as a fine-grained sedimentary rock that contains a high proporti ...Uintah Basin, Utah. Courtesy of [http://etv10news.com/first-commercial-oil-shale-mine-in-nation-to-be-housed-in-utah/ eTV10 News].]]6 KB (893 words) - 19:01, 14 March 2016
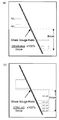
- ...thified sequence, they define the shale smear factor (SSF) as (see [[:File:Shale-smear-factor-fig2.png|Figure 1c]]) <math>\text{SSF} = \frac{\text{fault throw}}{\text{shale layer thickness}}</math>3 KB (437 words) - 20:02, 13 December 2016
File:Oil-shale-Copy.jpg http://etv10news.com/first-commercial-oil-shale-mine-in-nation-to-be-housed-in-utah/(600 × 450 (198 KB)) - 20:40, 25 June 2014- [[File:BarnettShalePlayFig1.png|thumb|300px|{{figure number|1}}Barnett Shale Field.<ref>[http://www.tceq.state.tx.us/assets/public/implementation/barnet ....tx.us/oil-gas/major-oil-gas-formations/barnett-shale-information/ Barnett Shale Information.]</ref>6 KB (909 words) - 19:24, 14 March 2019
- ...would be calculated, at a given point on a [[fault]] surface, for explicit shale beds (Equation 1): <math>\text{SGR} = \frac{\Sigma (\text{shale bed thickness})}{\text{fault throw}} \times 100%</math>3 KB (473 words) - 20:04, 11 March 2015
- | title = Shale Reservoirs: Giant Resources for the 21st Century | chapter = Shale-oil Resource Systems97 KB (14,873 words) - 19:53, 11 January 2024
File:Shale-gouge-ratio-fig3.png (259 × 526 (18 KB)) - 16:23, 9 September 2014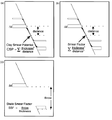
File:Shale-smear-factor-fig2.png (509 × 545 (23 KB)) - 19:21, 9 September 2014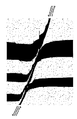
File:Shale Smear Factor Fig1.png (265 × 410 (16 KB)) - 20:17, 29 September 2014- | title = Shale Reservoirs: Giant Resources for the 21st Century | chapter = Shale-gas Resource Systems73 KB (10,728 words) - 18:16, 11 January 2024
File:Shale-Gas-Discussion-Group-hero.jpg (640 × 268 (31 KB)) - 23:53, 19 January 2021
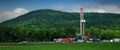
File:McCully shale New Brunswick rig.jpg (300 × 199 (30 KB)) - 16:17, 15 January 2014- ...sas. Approximately 2.5 million acres have been leased in the Fayetteville Shale gas play (Figure 1). Production of thermogenic gas from the Fayetteville b ...2050. EIA also reported that the proven gas reserves of the Fayetteville Shale in 2017 were 7.1 Tcf, an increase over the 2016 estimate of 6.3 Tcf.4 KB (598 words) - 21:52, 3 March 2022
- ...eported production included condensate and oil from wells in the Marcellus Shale. ...urce of 1.5 billion bbls in continuous-type accumulations in the Marcellus Shale. The estimate of natural gas resources ranged from 34 to 181 tcf (95 percen19 KB (2,773 words) - 21:36, 4 March 2022
- ..., and 2 Goddard Shale records (Fig. 1). Note the dominance of the Woodford Shale wells drilled. ...well completions map is shown in Figure 3. Note the dominance of the Caney Shale wells in the Arkoma, Ardmore and the Marietta Basins.3 KB (445 words) - 22:27, 4 March 2022
- ...tigraphic units. Note the interval commonly drilled in the Offshore Mancos Shale play. Modified from Hart<ref name=Hart>Hart, B. S., 2021, Stratigraphy and ...Juan Basin of New Mexico and Colorado. This summary focuses on the Mancos Shale play in the period 2017-2020 although other unconventional targets (e.g., t6 KB (985 words) - 20:14, 2 June 2021
- ...dominated by black siliceous mudstone (Fig. 2). The commercially producing shale interval has a thickness of 20-40m, an average TOC content of 2-4%, vitrini ...ion exceeding 200×103 m3. In order to achieve big breakthrough in the deep shale reservoir exploration, it is of great important to innovate drilling techno7 KB (985 words) - 18:54, 4 December 2023
- ...dark to light gray, is hard, and often has large jointing sets. The Mowry Shale is ranges in thickness from 150 to 250 ft and is a significant source rock ...bentonites that are found throughout the Mowry. EOG’s return to the Mowry Shale in 2018 with modern slickwater completions designs and two-mile laterals pr4 KB (677 words) - 17:14, 22 December 2023
- ...ston Basin, the Chattanooga Shale of the southeastern US, and the Woodford Shale of the southcentral US. ...produces both oil and gas[2, 6]. Natural gas produced from the New Albany Shale is a mixture of thermogenic and microbial gas[7].7 KB (1,107 words) - 21:50, 4 March 2022
- ...Journal of Petroleum Technology, from How Does Vaca Muerta Stack Up vs. US Shale? Data Tell the Tale]: SPE Journal of Petroleum Technology, December 2018</r ...nd J. W. Lee, 2020, Assessment of Oil and Gas Resources in the Vaca Muerta Shale, NeuquénBasin, Argentina: SPE Symposium on Latin American and Caribbean Pe11 KB (1,644 words) - 16:14, 11 May 2023
- ...020 Barnett2019-20CommRpt.jpg|200px|thumb|{{figure number|1}}Texas Barnett Shale total natural gas production 2000 through July 2020, https://www.rrc.state. In December 2019, Devon Energy sold its remaining interests in the Barnett Shale to BKV Oil & Gas, a subsidiary of Banpu Pcl (a Thailand-based coal-mining a3 KB (414 words) - 22:15, 2 June 2021
- ...d the Third member of Dongying Formation (Ed3) are the primary targets for shale oil exploration (Xue et al., 2020). '''Shale Oil Exploration'''8 KB (1,251 words) - 15:51, 14 March 2022
- The Utica Shale should be more aptly named the Point Pleasant Play. Most of the production ...ast and to the southeast. This same interval is an organic rich calcareous shale with a high carbonate content making it a good candidate for hydraulic frac3 KB (542 words) - 22:36, 4 March 2022
- ...mportant oil source rocks in the Junggar Basin. China's oldest continental shale is in the Permian strata of the Junggar Basin, which are composed of fine s ...continental shale in China: Taking the coexisting combination of tight and shale oil in the Permian Junggar Basin: Marine and Petroleum Geology, vol. 109, p6 KB (850 words) - 17:56, 20 December 2023
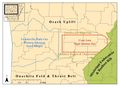
- ...ommRpt.jpg|300px|thumb|{{figure number|1}}Primary area of the Fayetteville Shale exploration and development in Arkansas.]] ...sas. Approximately 2.5 million acres have been leased in the Fayetteville Shale gas play ([[:file:Figure1 FayettevilleShale2019-20CommRpt.jpg|Figure 1]]).5 KB (645 words) - 22:38, 2 June 2021
- ...shale (TMS) continues to be a minor and largely undeveloped unconventional shale oil play. The potential production area spans over 20.4 million acres acro ...017; Self-Trail et al., 2019), which is equivalent to the upper Eagle Ford Shale in Texas. Workers also identified that the maximum flooding surface occurs7 KB (1,007 words) - 21:15, 3 March 2022


Page text matches
- [[File:ShaleUSGOV.jpg|thumb|300px|Shale.]] * [[Wikipedia:Shale|Shale (Wikipedia)]]245 bytes (30 words) - 20:16, 21 April 2015
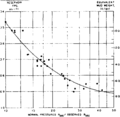
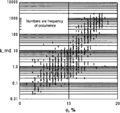
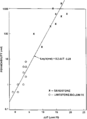
File:Pressure-detection fig4.png ...ly pressured shale divided by observed resistivity of abnormally pressured shale, plotted against formation pressure gradient (FPG) and equivalent mud weigh(926 × 899 (14 KB)) - 18:23, 14 January 2014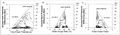
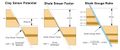
File:GumelarFigure7.jpg ...capacity in reservoir (a) Clay Smear Potential; (b) Shale Gouge Ratio; (c) Shale Smear Factor (Yielding et al, 1997).(880 × 256 (64 KB)) - 17:25, 29 September 2021- #REDIRECT [[Fault seal quantitative prediction: shale smear factor, shale gouge ratio, and smear gouge ratio]]110 bytes (15 words) - 21:32, 29 September 2014
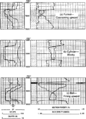
File:GumelarFigure6.jpg ...s in the fault plane. (a) Potential Clay Smear; (b) Shale Gouge Ratio; (c) Shale Smear Factor (redrawn from Yielding, 1997).(1,347 × 565 (92 KB)) - 17:25, 29 September 2021- | title = Shale Reservoirs: Giant Resources for the 21st Century ...evelopment in the early years of the 21st century. Now the exploitation of shale reservoirs is turning to natural gas liquids, condensate, and oil.2 members (0 subcategories, 0 files) - 15:32, 18 January 2022
File:Quick-look-lithology-from-logs fig1.png ...y. (c) Bell shape, fining upward. Note that coal is present in addition to shale.(945 × 1,311 (140 KB)) - 16:37, 14 January 2014- #REDIRECT [[Oil shale]]23 bytes (3 words) - 15:59, 1 July 2014
- #REDIRECT [[Barnett shale play]]32 bytes (4 words) - 19:22, 14 March 2019

File:Figure4FayettevilleShale2019-20CommRpt.jpg Fayetteville Shale well completion numbers.(979 × 664 (114 KB)) - 22:22, 2 June 2021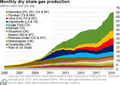
File:TightOilCommittee 2018-19 Figure2.jpg Monthly dry shale gas production (EIA, 2019).(468 × 331 (116 KB)) - 01:48, 20 January 2021- ...gouge ratio, the smear gouge ratio varies in an inverse manner; i.e., high shale gouge ratio corresponds to low smear gouge ratio and vice versa.911 bytes (124 words) - 13:49, 18 March 2019
File:Figure1 FayettevilleShale2019-20CommRpt.jpg Primary area of the Fayetteville Shale exploration and development in Arkansas.(906 × 666 (131 KB)) - 22:21, 2 June 2021
File:Figure3 FayettevilleShale2019-20CommRpt.jpg Weekly drill rig numbers in the Fayetteville Shale gas play (2011-2019).(979 × 414 (96 KB)) - 22:22, 2 June 2021- ...would be calculated, at a given point on a [[fault]] surface, for explicit shale beds (Equation 1): <math>\text{SGR} = \frac{\Sigma (\text{shale bed thickness})}{\text{fault throw}} \times 100%</math>3 KB (473 words) - 20:04, 11 March 2015
File:Core-log-transformations-and-porosity-permeability-relationships fig4.png ...ability versus helium porosity from North Sea sandstone, conglomerate, and shale.(941 × 890 (53 KB)) - 18:06, 14 January 2014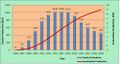
File:Figure2 FayettevilleShale2019-20CommRpt.jpg Annual and cumulative gas production of the Fayetteville Shale gas play.(979 × 529 (106 KB)) - 22:21, 2 June 2021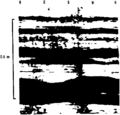
File:Borehole-imaging-devices fig4.png Borehole televiewer images showing shale layers (dark) intercalated with limestone layers (bright).(954 × 914 (16 KB)) - 18:53, 13 January 2014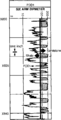
File:Dipmeters fig3.png Example of thin bed laminated sandstone-shale resolution by means of a dipmeter correlation curve.(941 × 1,852 (26 KB)) - 01:19, 14 January 2014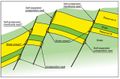
File:GumelarFigure1.jpg ...(fault blocks) of normal faults by the interbedded between sandstones and shale (modified Færseth, 2006).(594 × 390 (60 KB)) - 20:26, 28 September 2021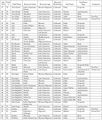
File:M106Ch12Table3.jpg ...anhydrite (arg limestone and anhydrite), marl, dense limestone, evaporite-shale, and evaporite-marl. Alternative or old reservoir names provided in comment(700 × 823 (153 KB)) - 15:35, 12 May 2016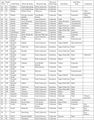
File:M106Ch12Table3a.jpg ...anhydrite (arg limestone and anhydrite), marl, dense limestone, evaporite-shale, and evaporite-marl. Alternative or old reservoir names provided in comment(700 × 896 (147 KB)) - 15:36, 12 May 2016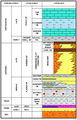
File:M115CH11FG05.jpg Simplified T-Block stratigraphy. Long. Sh. = Longicornis shale member. From AAPG Memoir 115—Rift-Related Coarse-Grained Submarine Fan Re(1,047 × 1,634 (744 KB)) - 15:22, 22 January 2019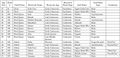
File:M106Ch12Table3b.jpg ...anhydrite (arg limestone and anhydrite), marl, dense limestone, evaporite-shale, and evaporite-marl. Alternative or old reservoir names provided in comment(700 × 336 (63 KB)) - 15:36, 12 May 2016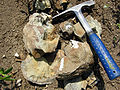
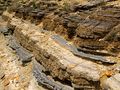
File:BrokenConcretion22.jpg A broken concretion with fossils inside; Upper Cretaceous Pierre shale, near Ekalaka, Montana. Photograph taken by Mark A. Wilson (Department of G(1,200 × 900 (698 KB)) - 16:20, 10 September 2014- ...thified sequence, they define the shale smear factor (SSF) as (see [[:File:Shale-smear-factor-fig2.png|Figure 1c]]) <math>\text{SSF} = \frac{\text{fault throw}}{\text{shale layer thickness}}</math>3 KB (437 words) - 20:02, 13 December 2016
- ..., and 2 Goddard Shale records (Fig. 1). Note the dominance of the Woodford Shale wells drilled. ...well completions map is shown in Figure 3. Note the dominance of the Caney Shale wells in the Arkoma, Ardmore and the Marietta Basins.3 KB (445 words) - 22:27, 4 March 2022
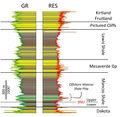
File:Figure1MancosCommRept.jpg ...tigraphic units. Note the interval commonly drilled in the Offshore Mancos Shale play. Modified from Hart (2021).(887 × 865 (285 KB)) - 20:49, 14 April 2021- An oil shale is defined as a fine-grained sedimentary rock that contains a high proporti ...Uintah Basin, Utah. Courtesy of [http://etv10news.com/first-commercial-oil-shale-mine-in-nation-to-be-housed-in-utah/ eTV10 News].]]6 KB (893 words) - 19:01, 14 March 2016
- ...). Hooking some stem-group "worms": fossil lophotrochozoans in the Burgess Shale. ''Bioessays'' '''28''', 1161–1166. {{doi|10.1002/bies.20507}}.1 KB (147 words) - 20:01, 4 November 2013
- ...ommRpt.jpg|300px|thumb|{{figure number|1}}Primary area of the Fayetteville Shale exploration and development in Arkansas.]] ...sas. Approximately 2.5 million acres have been leased in the Fayetteville Shale gas play ([[:file:Figure1 FayettevilleShale2019-20CommRpt.jpg|Figure 1]]).5 KB (645 words) - 22:38, 2 June 2021
- ...sas. Approximately 2.5 million acres have been leased in the Fayetteville Shale gas play (Figure 1). Production of thermogenic gas from the Fayetteville b ...2050. EIA also reported that the proven gas reserves of the Fayetteville Shale in 2017 were 7.1 Tcf, an increase over the 2016 estimate of 6.3 Tcf.4 KB (598 words) - 21:52, 3 March 2022
- ...tation.pdf Brittleness estimation from Seismic Measurements in the Barnett Shale]578 bytes (63 words) - 13:15, 24 September 2014
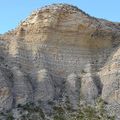
File:Eagle-ford-gets-spotlight04.jpg West Texas' Lozier Canyon offers an opportunity to examine Eagle Ford Shale outcrops at various scales across a sizable area. Photo by Art Donovan. Cou(400 × 400 (80 KB)) - 16:20, 18 June 2014- ...020 Barnett2019-20CommRpt.jpg|200px|thumb|{{figure number|1}}Texas Barnett Shale total natural gas production 2000 through July 2020, https://www.rrc.state. In December 2019, Devon Energy sold its remaining interests in the Barnett Shale to BKV Oil & Gas, a subsidiary of Banpu Pcl (a Thailand-based coal-mining a3 KB (414 words) - 22:15, 2 June 2021
File:Full-waveform-acoustic-logging fig3.png ...-measured permeability values for both the limestone-dolomite and the sand-shale examples. (After Burns et al., 1988.)(948 × 1,299 (12 KB)) - 14:23, 29 August 2014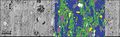
File:Figure-8.jpg A secondary electron image of a shale sample with an EDS-derived mineral segmentation overlay. In the segmented r(1,353 × 418 (106 KB)) - 17:34, 15 August 2014- ...-shale ratio of the fault zone. Sand-rich portions of the fault zone leak; shale-rich portions of the fault zone seal. Given the complex structure and compo ...marls as well as small amounts of brittle limestones. Faults with similar shale-rich gouge in producing fields create seals.4 KB (509 words) - 16:52, 29 March 2022
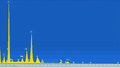
File:M102Ch1Fg7.jpg An example of an x-ray spectrum acquired from a shale sample. Individual peaks indicate an elevated concentration of a given elem(1,492 × 845 (1.24 MB)) - 22:24, 14 August 2014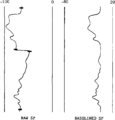
File:Log-analysis-applications fig2.png ...he raw SP curve, which represent zero deflection (that is, baseline = 100% shale). By projecting the baseline between two consecutive points, SP deflections(939 × 983 (9 KB)) - 16:36, 14 January 2014- ...general decline over the last 20 years (e.g., Permian Basin, Eagle Ford). Shale-oil production remained strong at approximately 7.4 million barrels per day [[file:TightOilCommittee_2018-19_Figure1.jpg|thumb|Figure 1: Current shale-gas and liquids unconventional plays in the Lower 48 States (EIA 2016)]]6 KB (820 words) - 20:57, 6 April 2021
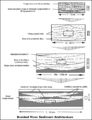
File:M91FG182.JPG Hierarchy of sandstone and shale bodies in braided river sediments from the Morrison Formation, Garfield Cou(800 × 1,040 (126 KB)) - 18:47, 12 August 2015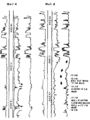
File:Pressure-detection fig3.png ...away and across a growth fault, showed a sudden decrease in resistivity of shale (increase in conductivity) at about 11,100 ft. Shortly thereafter, the well(912 × 1,211 (25 KB)) - 18:23, 14 January 2014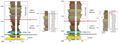
File:Figure2MancosCommRept.jpg Two examples of wells that produce from the Mancos Shale. The main completion target is an interval of the Upper Mancos that is some(1,679 × 617 (359 KB)) - 20:50, 14 April 2021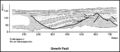
File:M91Ch13FG94.JPG ...e common in areas with thick delta sequences and mobile substrates such as shale or salt. This example is from Upper Triassic deltaic sediments exposed in t(800 × 345 (49 KB)) - 21:41, 29 April 2015- [[File:BarnettShalePlayFig1.png|thumb|300px|{{figure number|1}}Barnett Shale Field.<ref>[http://www.tceq.state.tx.us/assets/public/implementation/barnet ....tx.us/oil-gas/major-oil-gas-formations/barnett-shale-information/ Barnett Shale Information.]</ref>6 KB (909 words) - 19:24, 14 March 2019
- ==Shale ductility and density== ...op-and-fault-seal_fig10-35.png|thumb|300px|{{figure number|1}}Ductility of shale. Data from Hoshino et al.<ref name=ch10r37>Hoshino, K., Koide, H., Inami, K7 KB (1,000 words) - 15:22, 30 March 2022
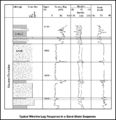
File:M91Ch6FG43.JPG Gamma-ray, density, neutron, and sonic log response of a sandstone and shale sequence. This example is from well 16/29a-9 in the Fleming field, UK North(800 × 827 (107 KB)) - 17:07, 3 June 2015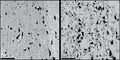
File:Figure-3.jpg A shale sample imaged using SE1 signal (left) and SE2 signal (right). Surface-speci(1,502 × 746 (180 KB)) - 17:32, 15 August 2014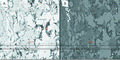
File:M102Ch1Fg4.jpg SE2 (a) and BSE1 (b) image of a cross section of a shale rock. Note that the contrast between carbonate (ca) and silica (si) grains(1,492 × 746 (1.74 MB)) - 21:56, 14 August 2014


